









 By: Mendy Perlman
|
Updated: June 21, 2026
|
Fact Checked
|
By: Mendy Perlman
|
Updated: June 21, 2026
|
Fact Checked
|
Cite this Research
Cite this research
Perlman, M. (2026, June 21). How much energy do data centers use? Web Hosting Services. https://webhostingservices.co/research/data-center-energy-statistics
Perlman, Mendy. “How Much Energy Do Data Centers Use?” Web Hosting Services, 21 June 2026, https://webhostingservices.co/research/data-center-energy-statistics.
Perlman, Mendy. “How Much Energy Do Data Centers Use?” Web Hosting Services. Last modified June 21, 2026. https://webhostingservices.co/research/data-center-energy-statistics.
What share of electricity do data centers consume?
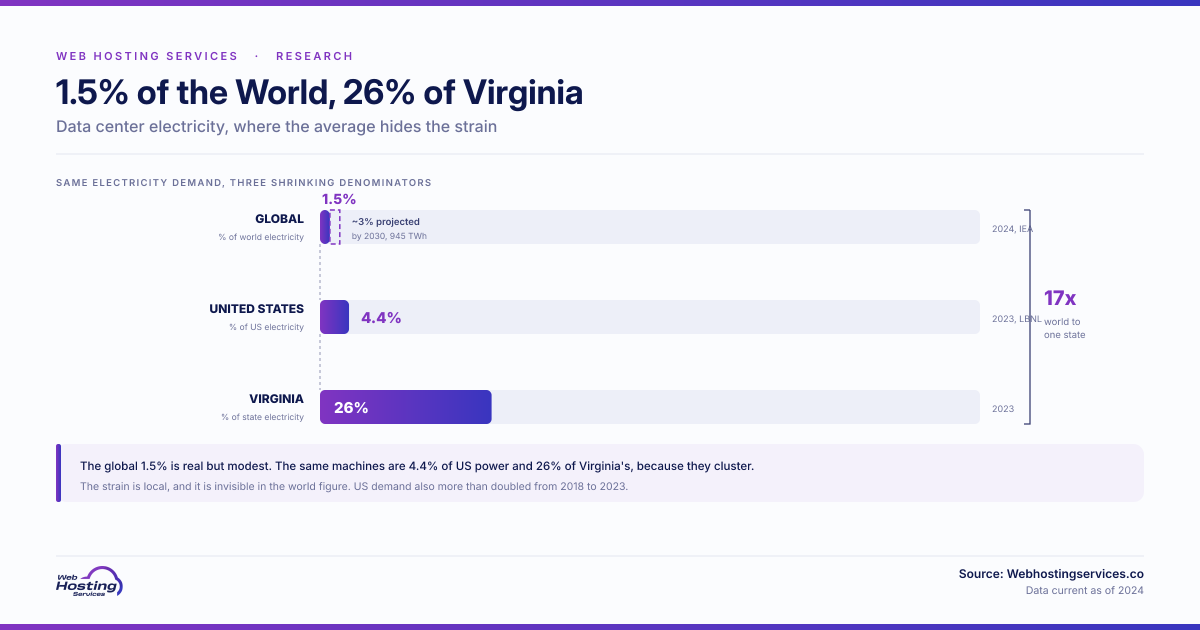
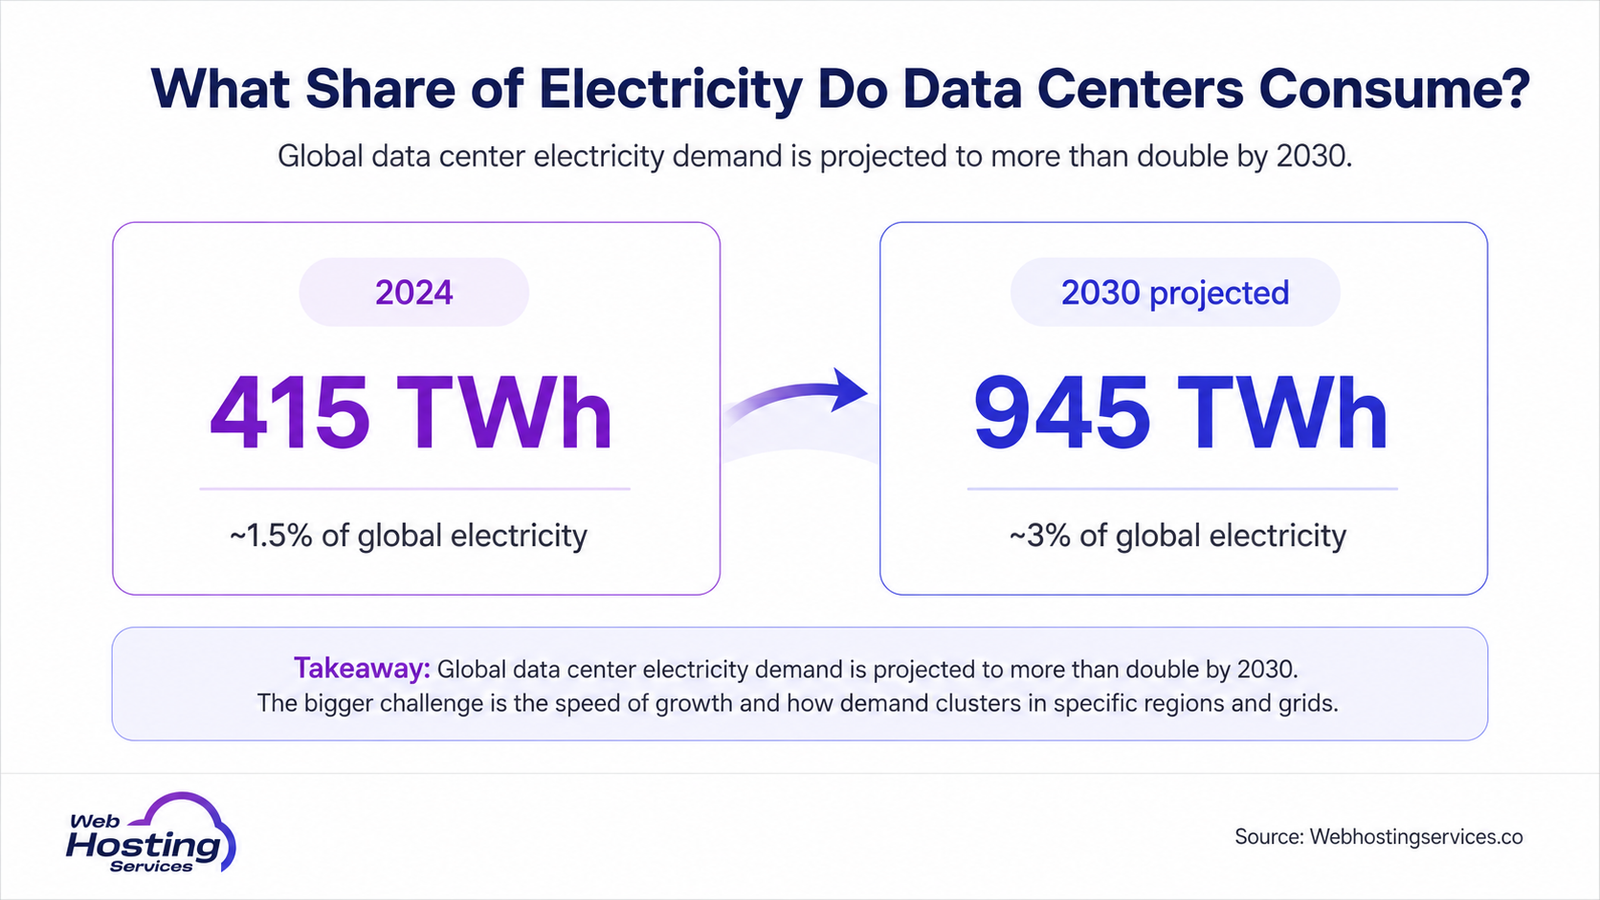
- Data centers consumed about 415 TWh of electricity in 2024, roughly 1.5% of the global total.
- The IEA projects this will more than double to 945 TWh by 2030.
- That 2030 figure would be just under 3% of all global electricity.
- In the IEA Base Case, data center electricity demand is projected to grow about 15% a year from 2024 to 2030, more than four times faster than electricity demand from other sectors.
- The US and China together account for nearly 80% of the projected growth.
Year | Consumption | Share of global electricity |
2024 | 415 TWh | ~1.5% |
2030 (projected) | 945 TWh | ~3% |
The headline share stays modest even after doubling, which is worth keeping in perspective. The concern is less the global percentage and more the speed of growth and how tightly that demand clusters in a few regions and grids.
How much electricity do US data centers use?
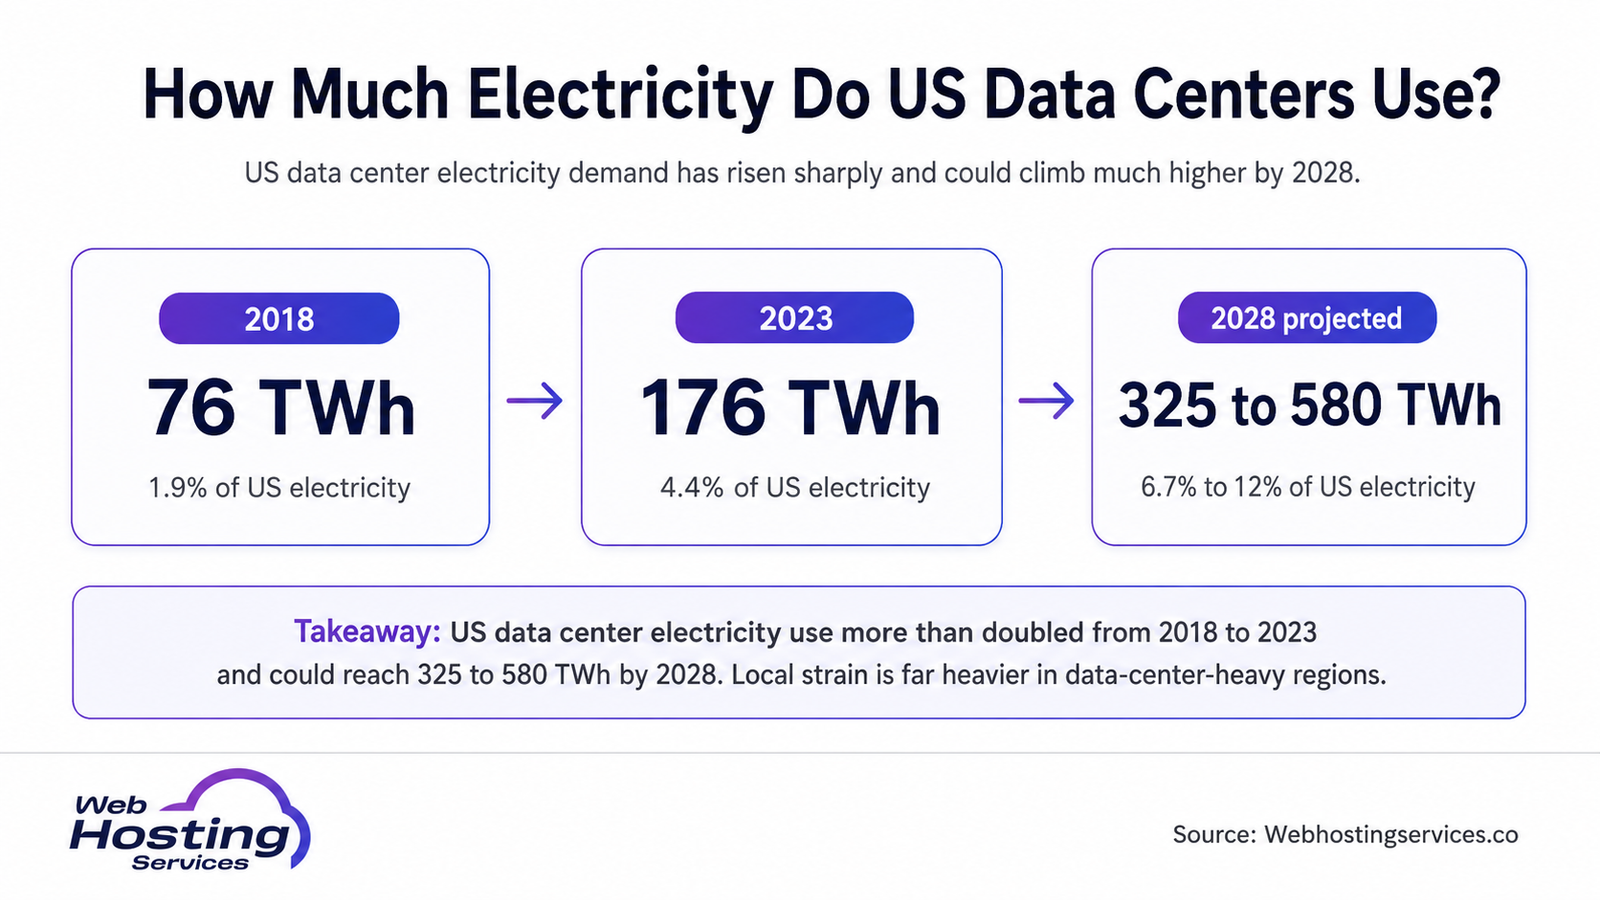
- US data centers consumed 176 TWh of electricity in 2023, per the Lawrence Berkeley National Lab.
- That was about 4.4% of total US electricity, up from 1.9% in 2018.
- Consumption is projected to reach 325 to 580 TWh by 2028, or 6.7% to 12% of US power.
- The IEA estimates US data centers used 183 TWh in 2024, similar to Pakistan’s annual demand.
- Demand is geographically concentrated, reaching 26% of Virginia’s electricity in 2023.
Year | US consumption | Share of US electricity |
2018 | 76 TWh | 1.9% |
2023 | 176 TWh | 4.4% |
2028 (projected) | 325 to 580 TWh | 6.7% to 12% |
The US share is already well above the global average and rising fast. Because data centers cluster in specific states, the local strain is far heavier than national figures suggest, as Virginia’s grid shows.
How much water do data centers use?
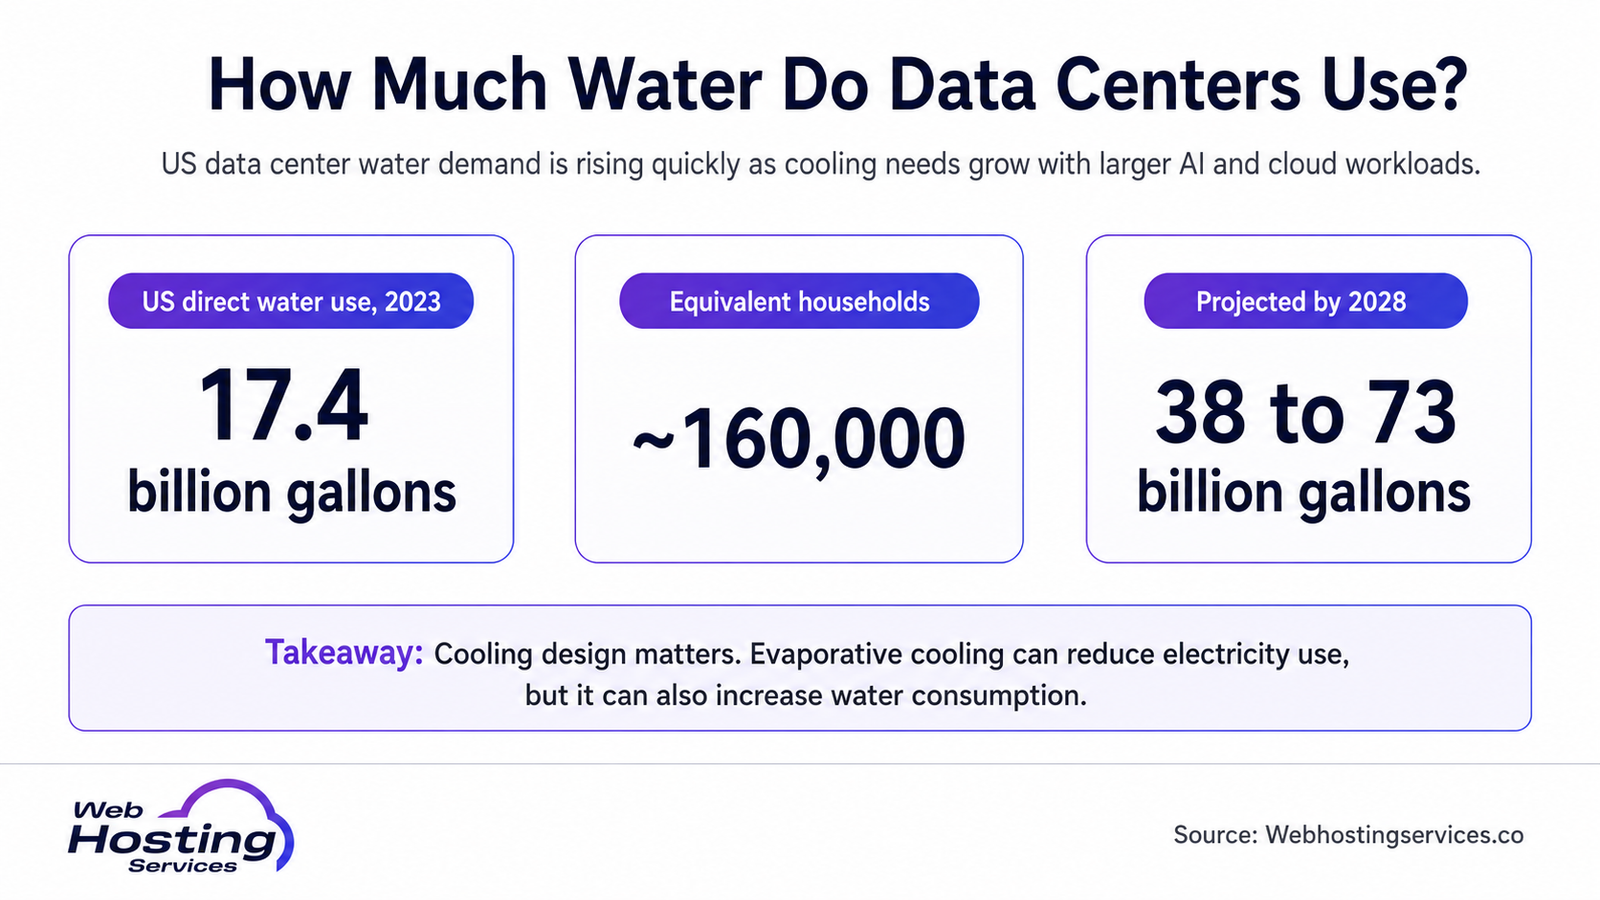
- US data centers directly consumed 17.4 billion gallons of water in 2023 for cooling.
- That is roughly the annual water use of 160,000 American households.
- LBNL’s 2023 estimates imply an indirect water footprint about 12 times larger than direct water consumption, mostly through electricity generation.
- Direct consumption is projected to reach 38 to 73 billion gallons by 2028.
- Cooling choice matters enormously, with air-cooled sites using a tiny fraction of water-cooled ones.
Metric | Figure |
US direct water use (2023) | 17.4 billion gallons |
Equivalent households | ~160,000 |
Projected by 2028 | 38 to 73 billion gallons |
Water is the overlooked cost of the AI boom. Evaporative cooling saves electricity but consumes water, so operators face a real tradeoff, and newer direct-to-chip and air-cooled designs are starting to cut the water bill sharply.
How much power do AI data centers need?
- As a proxy for AI-related electricity use, the IEA uses accelerated servers, which accounted for about 15% of total data center electricity demand in 2024.
- Those accelerated servers made up roughly 24% of server electricity demand specifically.
- In the IEA Base Case, electricity consumption from accelerated servers is projected to grow about 30% a year.
- A typical AI hyperscaler uses as much power as 100,000 households.
- The largest facilities now under construction are expected to use 20 times as much.
Metric | Figure |
Accelerated-server share of data center electricity demand (proxy for AI) | ~15% |
Accelerated-server electricity growth, IEA Base Case | ~30% / year |
Largest AI facilities | ~2 million households |
AI is the most important driver of the demand surge, alongside continued growth in other digital services. By 2030, the IEA projects US data centers will use more electricity than the production of aluminum, steel, cement, chemicals and all other energy-intensive goods combined.
How energy-efficient are data centers (PUE)?
Note: PUE figures come from industry surveys and vary by facility, so these are representative averages.
- Efficiency is measured by Power Usage Effectiveness (PUE), where 1.0 is the ideal.
- The industry average PUE has plateaued at around 1.54 in recent years, per the Uptime Institute.
- A PUE of 1.5 means 50% extra power beyond computing goes to cooling and overhead.
- Best-in-class hyperscale facilities reach around 1.1 to 1.2, far more efficient.
- Google reported a 2024 fleet-wide PUE of 1.09, well below Uptime Institute’s 2025 industry average of 1.54.
Facility type | Typical PUE |
Industry average | ~1.54 |
Best-in-class hyperscale | ~1.1 to 1.2 |
Theoretical ideal | 1.0 |
The gap between average and best is the opportunity. Hyperscalers have pushed PUE close to the physical limit, while the broader industry average has stalled, which is why efficiency gains increasingly come from the largest operators.
How much do data centers contribute to carbon emissions?
Note: emissions estimates vary by methodology and energy mix, so these figures are approximate.
- The IEA estimates global data centers were responsible for about 180 million tonnes of indirect CO2 emissions from electricity use in 2024, around 0.5% of global fuel-combustion CO2 emissions.
- A 2024 research estimate put US data center emissions at more than 105 million tons of CO2e, about 2.18% of US emissions in 2023.
- That was roughly three times the 31.5 million tons of CO2e estimated for 2018.
- Natural gas supplied over 40% of US data center electricity in 2024.
- Renewables provided about 24%, nuclear around 20% and coal near 15%.
Metric | Figure |
Global indirect emissions from electricity use (2024) | ~180 million tonnes CO2 |
US estimated emissions | 105+ million tons CO2e |
US estimated emissions (2018) | 31.5 million tons CO2e |
The emissions trajectory tracks the energy mix powering these facilities. With natural gas still dominant, tech companies are turning to nuclear deals and renewables to curb the carbon cost of growth. For greener options, see our sustainable web hosting research.
Sources & additional resources
- IEA. “Energy and AI.” International Energy Agency.
- Lawrence Berkeley National Laboratory. “2024 United States Data Center Energy Usage Report.” LBNL.
- MOST Policy Initiative. “Data Center Water Use.” MOST Policy Initiative.
- Pew Research Center. “Energy Use at US Data Centers Amid the AI Boom.” Pew Research Center.
- Uptime Institute. “Global Data Center Survey 2025.” Uptime Institute.
- Google. “Power Usage Effectiveness.” Google Data Centers.
- EESI. “Data Center Energy Needs and the Climate.” Environmental and Energy Study Institute.
- Guidi et al. “Environmental Burden of United States Data Centers in the Artificial Intelligence Era.” arXiv.
Web Hosting Services helps you host responsibly, with independent hosting and sustainability research, current hosting deals plus managed WordPress hosting on efficient, modern infrastructure.