








Website speed and performance statistics
 By: Mendy Perlman
|
Updated: July 12, 2026
|
✓Fact Checked
|
By: Mendy Perlman
|
Updated: July 12, 2026
|
✓Fact Checked
|
Cite this Research
Cite this research
Perlman, M. (2026, July 12). Website speed statistics. Web Hosting Services. https://webhostingservices.co/research/website-speed-statistics
Perlman, Mendy. “Website Speed Statistics.” Web Hosting Services, 12 July 2026, https://webhostingservices.co/research/website-speed-statistics.
Perlman, Mendy. “Website Speed Statistics.” Web Hosting Services. Last modified July 12, 2026. https://webhostingservices.co/research/website-speed-statistics.
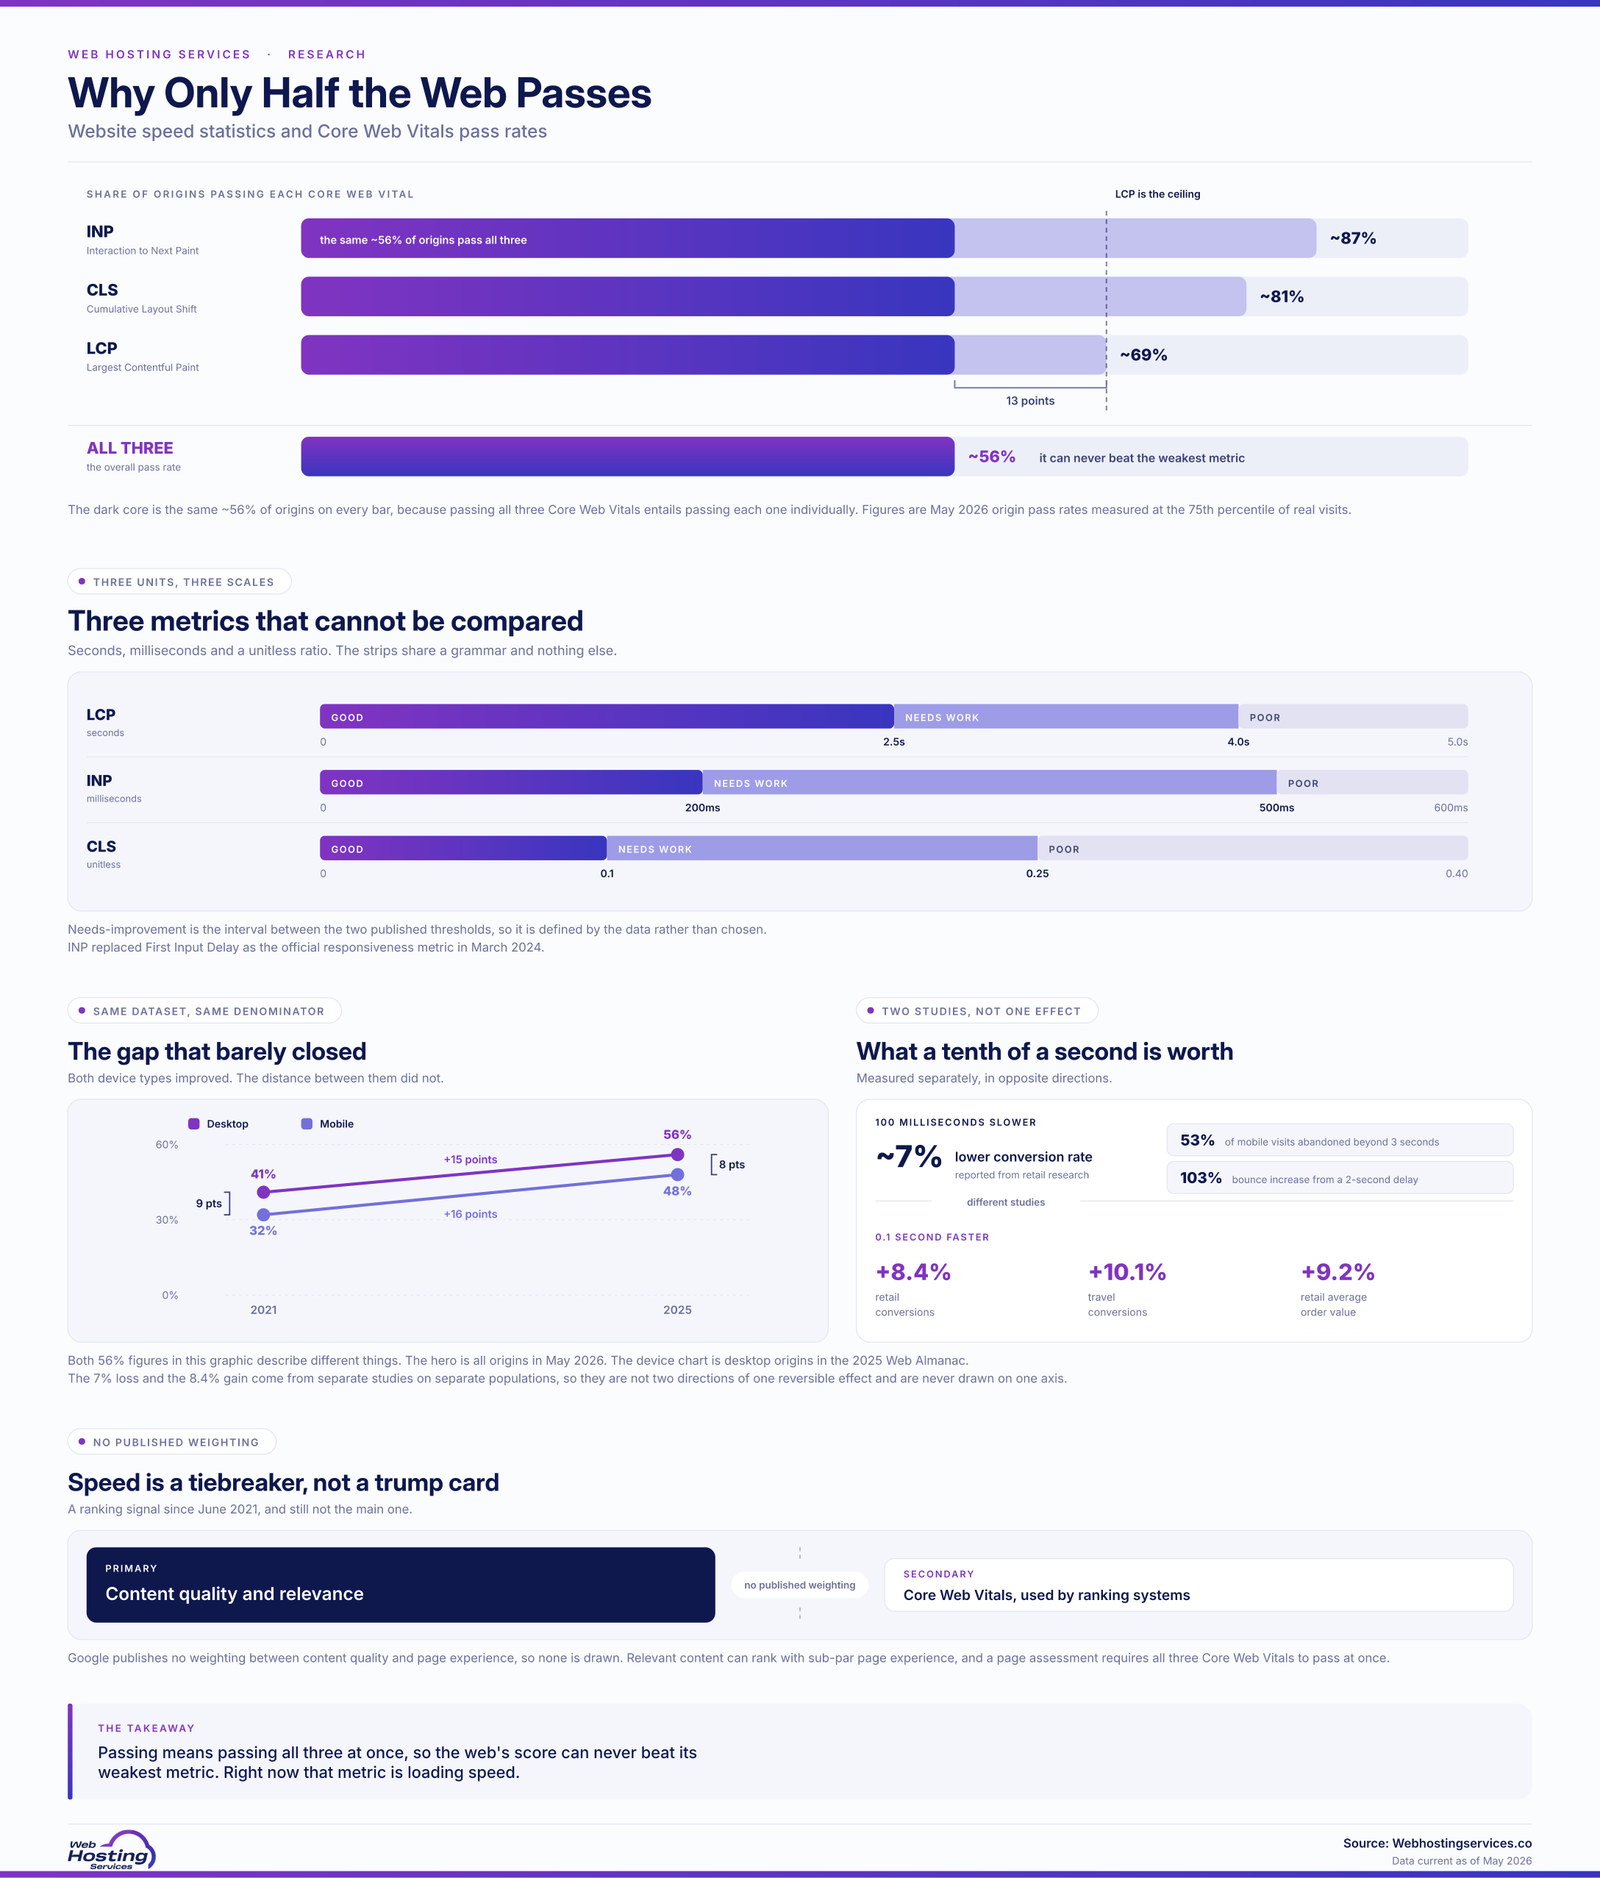
Research highlights: As of May 2026 CrUX data, about 56% of origins pass all three Core Web Vitals. Largest Contentful Paint is the hardest metric, with around 69% of origins meeting the 2.5-second threshold. Akamai has reported that a 100-millisecond delay in website load time can hurt conversion rates by 7%, and Google says 53% of mobile visits are likely to be abandoned if pages take longer than 3 seconds to load.
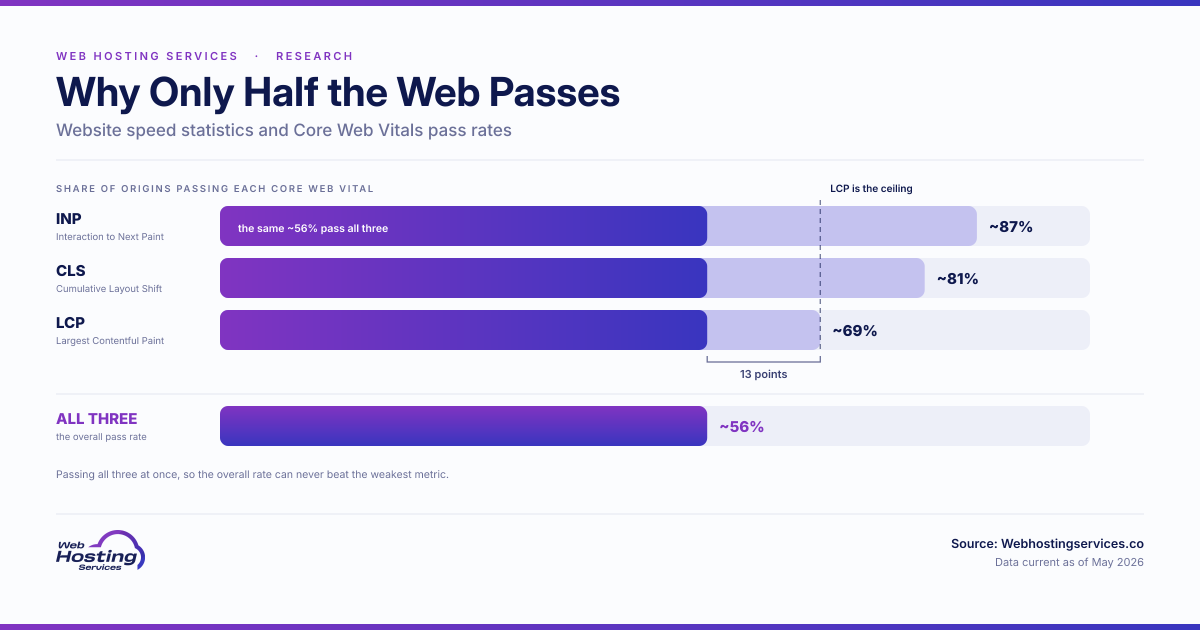
What percent of websites pass Core Web Vitals?
Note: Core Web Vitals figures are measured using real user data from Chrome and update roughly monthly, so these are recent readings.
- About 56% of origins pass all three Core Web Vitals, per May 2026 Chrome UX Report data.
- Largest Contentful Paint (LCP) is the hardest single metric, with roughly 69% of origins meeting the 2.5-second threshold.
- Cumulative Layout Shift (CLS) has a good-experience rate of around 81% of origins.
- Interaction to Next Paint (INP) sits highest of the three, at roughly 87% of origins.
- All three metrics must pass at the 75th percentile of real visits for a page to earn an overall “good” rating.
|
Metric |
Origin pass rate |
|
Overall (all three metrics) |
~56% |
|
Largest Contentful Paint |
~69% |
|
Cumulative Layout Shift |
~81% |
|
Interaction to Next Paint |
~87% |
Just over half the web now clears Google’s full bar for a good user experience. Loading speed remains the weak link, since visual stability and responsiveness are easier fixes than getting the biggest visible element on screen quickly.
What are Google’s Core Web Vitals thresholds?
- LCP (Largest Contentful Paint) is good at 2.5 seconds or less, poor beyond 4 seconds.
- INP (Interaction to Next Paint) is good at 200 milliseconds or less, poor beyond 500 milliseconds.
- CLS (Cumulative Layout Shift) is good at 0.1 or lower, poor beyond 0.25.
- INP replaced First Input Delay as the official responsiveness metric in March 2024.
- Google treats stable Core Web Vitals as relatively stable metrics, but the set can evolve, as shown when INP replaced First Input Delay in March 2024.
|
Metric |
Good |
Poor |
|
LCP |
2.5s or less |
Over 4.0s |
|
INP |
200ms or less |
Over 500ms |
|
CLS |
0.1 or lower |
Over 0.25 |
These thresholds are deliberately strict, since they are meant to reflect what feels instant to a real user rather than what is merely acceptable. Meeting all three at once, across most visits, is genuinely difficult for a busy commercial website.
How does mobile speed compare to desktop?
- In 2025 Web Almanac data, 56% of desktop origins passed all three Core Web Vitals, versus 48% of mobile origins.
- That is an 8 percentage point gap favoring desktop.
- Mobile pass rates have climbed steadily, from 32% in 2021 to 48% in 2025.
- Desktop rose over the same stretch too, from 41% to 56%.
- The gap persists mainly because mobile networks and weaker hardware make fast rendering harder.
|
Year |
Desktop pass rate |
Mobile pass rate |
|
2021 |
41% |
32% |
|
2025 |
56% |
48% |
The web is getting faster on both device types, but unevenly. Mobile still trails desktop by a meaningful margin, which matters given how much traffic now arrives on phones over patchier, slower connections. For the infrastructure side, see our CDN market share research.
How does page speed affect conversions and revenue?
Note: these figures come from company-reported case studies and industry research, so results vary by site and sector.
- Akamai has reported that a 100-millisecond delay in website load time can hurt conversion rates by about 7%.
- 53% of mobile visitors abandon a page that takes longer than 3 seconds to load.
- The same Akamai research found a two-second delay can increase bounce rates by 103%.
- Google and Deloitte’s “Milliseconds Make Millions” study found a 0.1-second mobile speed improvement lifted retail conversions by 8.4% and travel conversions by 10.1%.
- The same study found average order value rose 9.2% for retail sites with that same 0.1-second gain.
|
Finding |
Impact |
|
100-millisecond delay |
Up to ~7% lower conversion rate, per Akamai |
|
0.1s faster (retail) |
+8.4% conversions, +9.2% AOV |
|
0.1s faster (travel) |
+10.1% conversions |
The financial case for speed is not theoretical. Fractions of a second show up directly in checkout completion, average order value and how many visitors stick around, which is why performance work keeps paying for itself on revenue-generating sites.
Is Core Web Vitals a Google ranking factor?
- Google confirmed Core Web Vitals as a ranking signal starting in June 2021.
- Google says page experience can contribute to Search success when many helpful results are available, but relevant content can still rank even with sub-par page experience.
- Strong content and relevance still outweigh Core Web Vitals in Google’s own guidance.
- A page assessment requires all three metrics to pass at once, not just one or two.
- Poor Core Web Vitals will not necessarily sink genuinely strong content, but strong page experience can help when users have many helpful results to choose from.
|
Factor |
Role in ranking |
|
Content quality and relevance |
Primary factor |
|
Core Web Vitals |
Used by ranking systems, but not a replacement for relevance |
Speed will not rescue thin or irrelevant content, and it will not usually bury genuinely excellent content either. Where it matters most is when users have many helpful results to choose from, because Google says a great page experience can contribute to Search success in those cases. For hosting choices that support faster sites, see our web hosting cost research.
Sources & additional resources
- HTTP Archive. “Performance Chapter, 2025 Web Almanac.” HTTP Archive.
- Chrome UX Report. “The 202605 Dataset Is Live.” Chrome UX Report Announcements.
- web.dev. “Web Vitals.” web.dev by Google.
- web.dev. “Milliseconds Make Millions.” web.dev by Google.
- Deloitte. “Milliseconds Make Millions.” Deloitte Ireland.
- Akamai. “Akamai Releases Spring 2017 State of Online Retail Performance Report.” Akamai.
- Google AdSense Help. “Make Your Mobile Pages Load Faster.” Google Help.
- Google Search Central. “Understanding Core Web Vitals and Google Search Results.” Google Search Central.
- Google Search Central. “Understanding Page Experience in Google Search Results.” Google Search Central.
- Google Search Central. “More Time, Tools, and Details on the Page Experience Update.” Google Search Central Blog.
Web Hosting Services helps you build a faster site, with performance and hosting research, hosting deals and managed WordPress hosting for site owners who want help with performance, maintenance and reliability.
Disclaimer: This article is for informational purposes only and is not legal, technical, SEO, financial, business, hosting, performance-engineering or purchasing advice. Website speed statistics, Core Web Vitals pass rates, CrUX data, load-time benchmarks, mobile and desktop performance figures, conversion-impact claims, revenue case studies, ranking-factor guidance, page-experience documentation and third-party methodologies can change at any time and may vary by source, reporting period, device type, geography, browser, network conditions, website category, traffic sample and measurement method. Always confirm current figures, performance requirements, SEO guidance, hosting needs, optimization priorities, business assumptions and methodology directly with the cited data provider, search engine documentation, analytics platform, hosting provider, technical expert or qualified professional before making website performance, SEO, hosting, business or purchasing decisions based on website speed statistics.