





Mobile versus desktop web traffic statistics

Mendy Perlman, Researcher at Web Hosting Services By: Mendy Perlman | Updated: July 8, 2026 | Fact Checked |
Cite this Research

Cite this research

APA

Perlman, M. (2026, July 8). Mobile versus desktop web traffic statistics. Web Hosting Services. https://webhostingservices.co/research/mobile-vs-desktop-traffic

MLA

Perlman, Mendy. “Mobile Versus Desktop Web Traffic Statistics.” Web Hosting Services, 8 July 2026, https://webhostingservices.co/research/mobile-vs-desktop-traffic.

Chicago

Perlman, Mendy. “Mobile Versus Desktop Web Traffic Statistics.” Web Hosting Services. Last modified July 8, 2026. https://webhostingservices.co/research/mobile-vs-desktop-traffic.
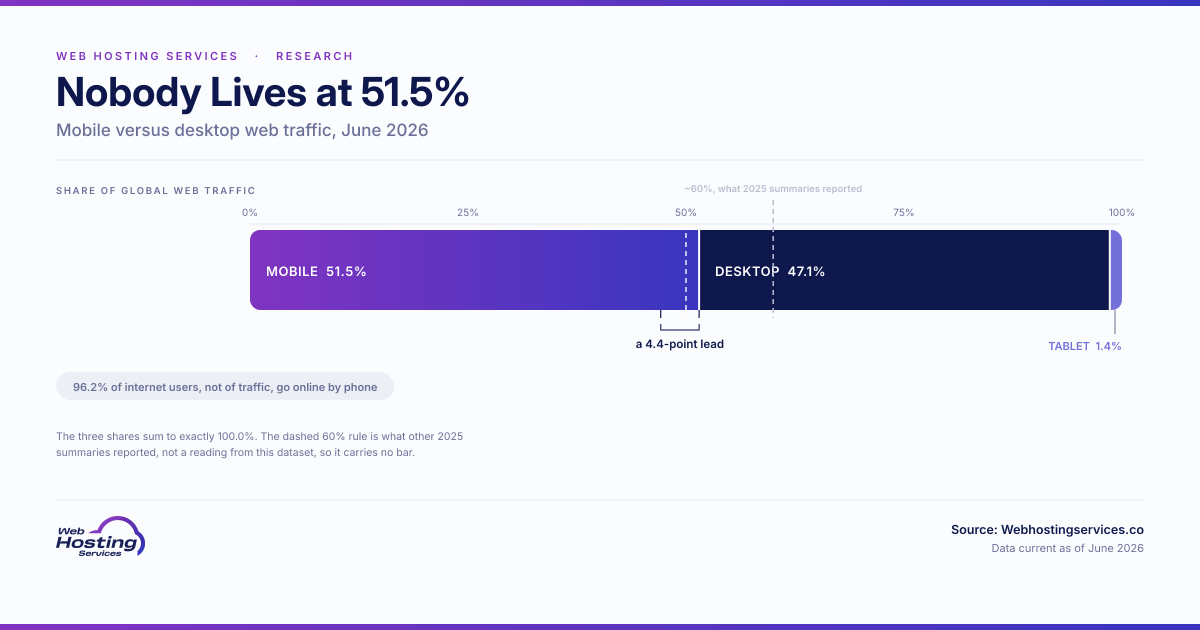
Research highlights: Mobile devices hold about 51.5% of global web traffic as of June 2026, with desktop at 47.1% and tablets at 1.4%. That is a narrower split than many 2025 summaries reported, when mobile was commonly cited near or above 60%. Mobile and tablet usage combined first overtook desktop worldwide in 2016. The split still swings widely by region, from mobile-majority markets like India and Nigeria to more desktop-heavy markets like the United States, Germany and Japan.

Featured image showing the global device split with mobile at 51.5%, desktop at 47.1% and tablets at 1.4%, a 4.4-point mobile lead and a dashed rule marking the 60% figure other summaries reported.
Mobile holds 51.5% of global web traffic, a four-point lead, not the 60% most 2025 summaries reported.

What share of web traffic is mobile versus desktop?

Note: the split has narrowed quickly in 2026 and varies by source and month, so treat any single figure as a snapshot.

  • Mobile holds about 51.5% of global web traffic as of June 2026, per StatCounter.
  • Desktop accounts for about 47.1%, and tablets for about 1.4%.
  • That is a narrower split than many 2025 mobile-traffic summaries, which commonly put mobile near or above 60%.
  • DataReportal says 96.2% of internet users worldwide use a mobile phone to go online at least some of the time.
  • Month-to-month readings can still shift by several points, so the headline figure is a moving target.

Device

Share of global traffic (June 2026)

Mobile

~51.5%

Desktop

~47.1%

Tablet

~1.4%

The honest version skips the single tidy number. Mobile’s lead has narrowed fast this year, and trackers still disagree on the precise split, but the direction over the past decade is settled: any site reaching a broad audience must treat the phone as a primary screen.


How has mobile traffic share changed over time?

  • In 2009, mobile was about 0.7% of traffic while desktop held about 99.3%.
  • Mobile and tablet usage together crossed the 50% mark for the first time in October 2016, according to StatCounter.
  • It held the global majority through most of the years since, though the lead has narrowed sharply in 2026.
  • Mobile’s share rose dramatically from the mid-2010s through 2024 before narrowing in 2026.
  • Desktop’s share fell from near-total dominance to under half before partly recovering in 2026.

Year

Mobile share

2009

~0.7%

2016

Mobile + tablet crossed 50%

2026

~51.5%

The reversal over 15 years has been dramatic. A platform that barely registered in 2009 came to drive most of the world’s web activity, a shift powered by cheap smartphones and mobile-first internet adoption across emerging markets, even as the gap has narrowed more recently.


How does the mobile versus desktop split vary by region?

Note: country figures below come from StatCounter’s June 2026 desktop, mobile and tablet platform-share pages and can shift from month to month.

  • Nigeria is mobile-majority, at about 61.5% mobile in StatCounter’s June 2026 data.
  • India is strongly mobile-first, at about 67.2% mobile.
  • The United States is desktop-heavy, with mobile at about 39.7%.
  • Germany sits at about 43.6% mobile, among the more desktop-leaning major economies.
  • Japan is similarly desktop-heavy, at about 43.0% mobile.

Country

Mobile share, StatCounter June 2026

Nigeria

~61.5%

India

~67.2%

United States

~39.7%

Germany

~43.6%

Japan

~43.0%

Regional gaps explain the messy global average. Mobile-majority markets like India and Nigeria pull the worldwide figure up, while markets such as the United States, Germany and Japan remain more desktop-heavy in StatCounter’s June 2026 data.


How do mobile and desktop compare in ecommerce traffic, sales and conversion?

Note: ecommerce figures come from retail and industry benchmark sources that vary by sector, region and method; device conversion patterns are source-dependent rather than universal.

  • Mobile drives the bulk of ecommerce browsing. Dynamic Yield’s live rolling benchmark puts it at roughly 75% of ecommerce site traffic over the trailing twelve months, though this figure updates monthly and shifts by a point or two each time it’s checked.
  • Global mobile commerce sales reached $2.07 trillion in 2024.
  • They are projected to hit $3.35 trillion by 2028.
  • Mobile commerce accounted for about 57% of total retail ecommerce sales in 2024.
  • Device conversion rates vary by benchmark and shift over time, so treat any single conversion figure as a snapshot rather than a fixed fact.

Metric

Figure

Mobile share of ecommerce traffic (rolling 12-month average)

~75%

Mobile commerce sales (2024)

$2.07 trillion

Projected mobile commerce sales (2028)

$3.35 trillion

Mobile share of retail ecommerce sales (2024)

~57%

The ecommerce picture is more nuanced than a single device split. Mobile dominates browsing and drives a majority of retail ecommerce sales in some estimates, but which device actually converts best depends heavily on the benchmark, sector and region you’re looking at. See our Shopify statistics research.


How much web traffic comes from tablets?

  • Tablets account for roughly 1.4% of global web traffic as of June 2026.
  • The share sat around 1.6% to 1.8% through mid-2025 and has kept sliding since.
  • StatCounter reported global tablet internet usage at 4.8% in November 2013, far above today’s level.
  • Tablet traffic has since fallen to a much smaller share of global web traffic.
  • Larger phones and lighter laptops have likely reduced tablets’ role as a distinct browsing device, though patterns vary by market.

Metric

Figure

Current tablet share (June 2026)

~1.4%

Mid-2025 tablet share

~1.6% to 1.8%

StatCounter tablet usage reference point (Nov. 2013)

4.8%

The tablet’s story runs opposite to mobile’s. Once a more meaningful browsing category, tablets now represent a small slice of global web traffic, while phones and desktops account for nearly all measured activity. See our website speed research.


Sources & additional resources

Web Hosting Services helps you win on every screen, with independent web and hosting research, current hosting deals and managed WordPress hosting with caching, a built-in CDN and tuned servers built to keep pages quick.

Disclaimer: This article is for informational purposes only and is not legal, technical, SEO, analytics, financial, ecommerce, business, hosting or purchasing advice. Mobile versus desktop traffic statistics, device-share estimates, regional usage data, ecommerce traffic and sales figures, mobile commerce projections, tablet traffic trends, conversion benchmarks, tracker data and third-party methodologies can change at any time and may vary by source, reporting period, geography, device category, browser, website type, industry, traffic sample, analytics setup and measurement definition. Always confirm current figures, audience assumptions, ecommerce benchmarks, analytics data, performance requirements, hosting needs and methodology directly with the cited data provider, analytics platform, ecommerce benchmark source, hosting provider, technical documentation or qualified professional before making website design, mobile optimization, ecommerce, hosting, business or purchasing decisions based on mobile versus desktop traffic statistics.

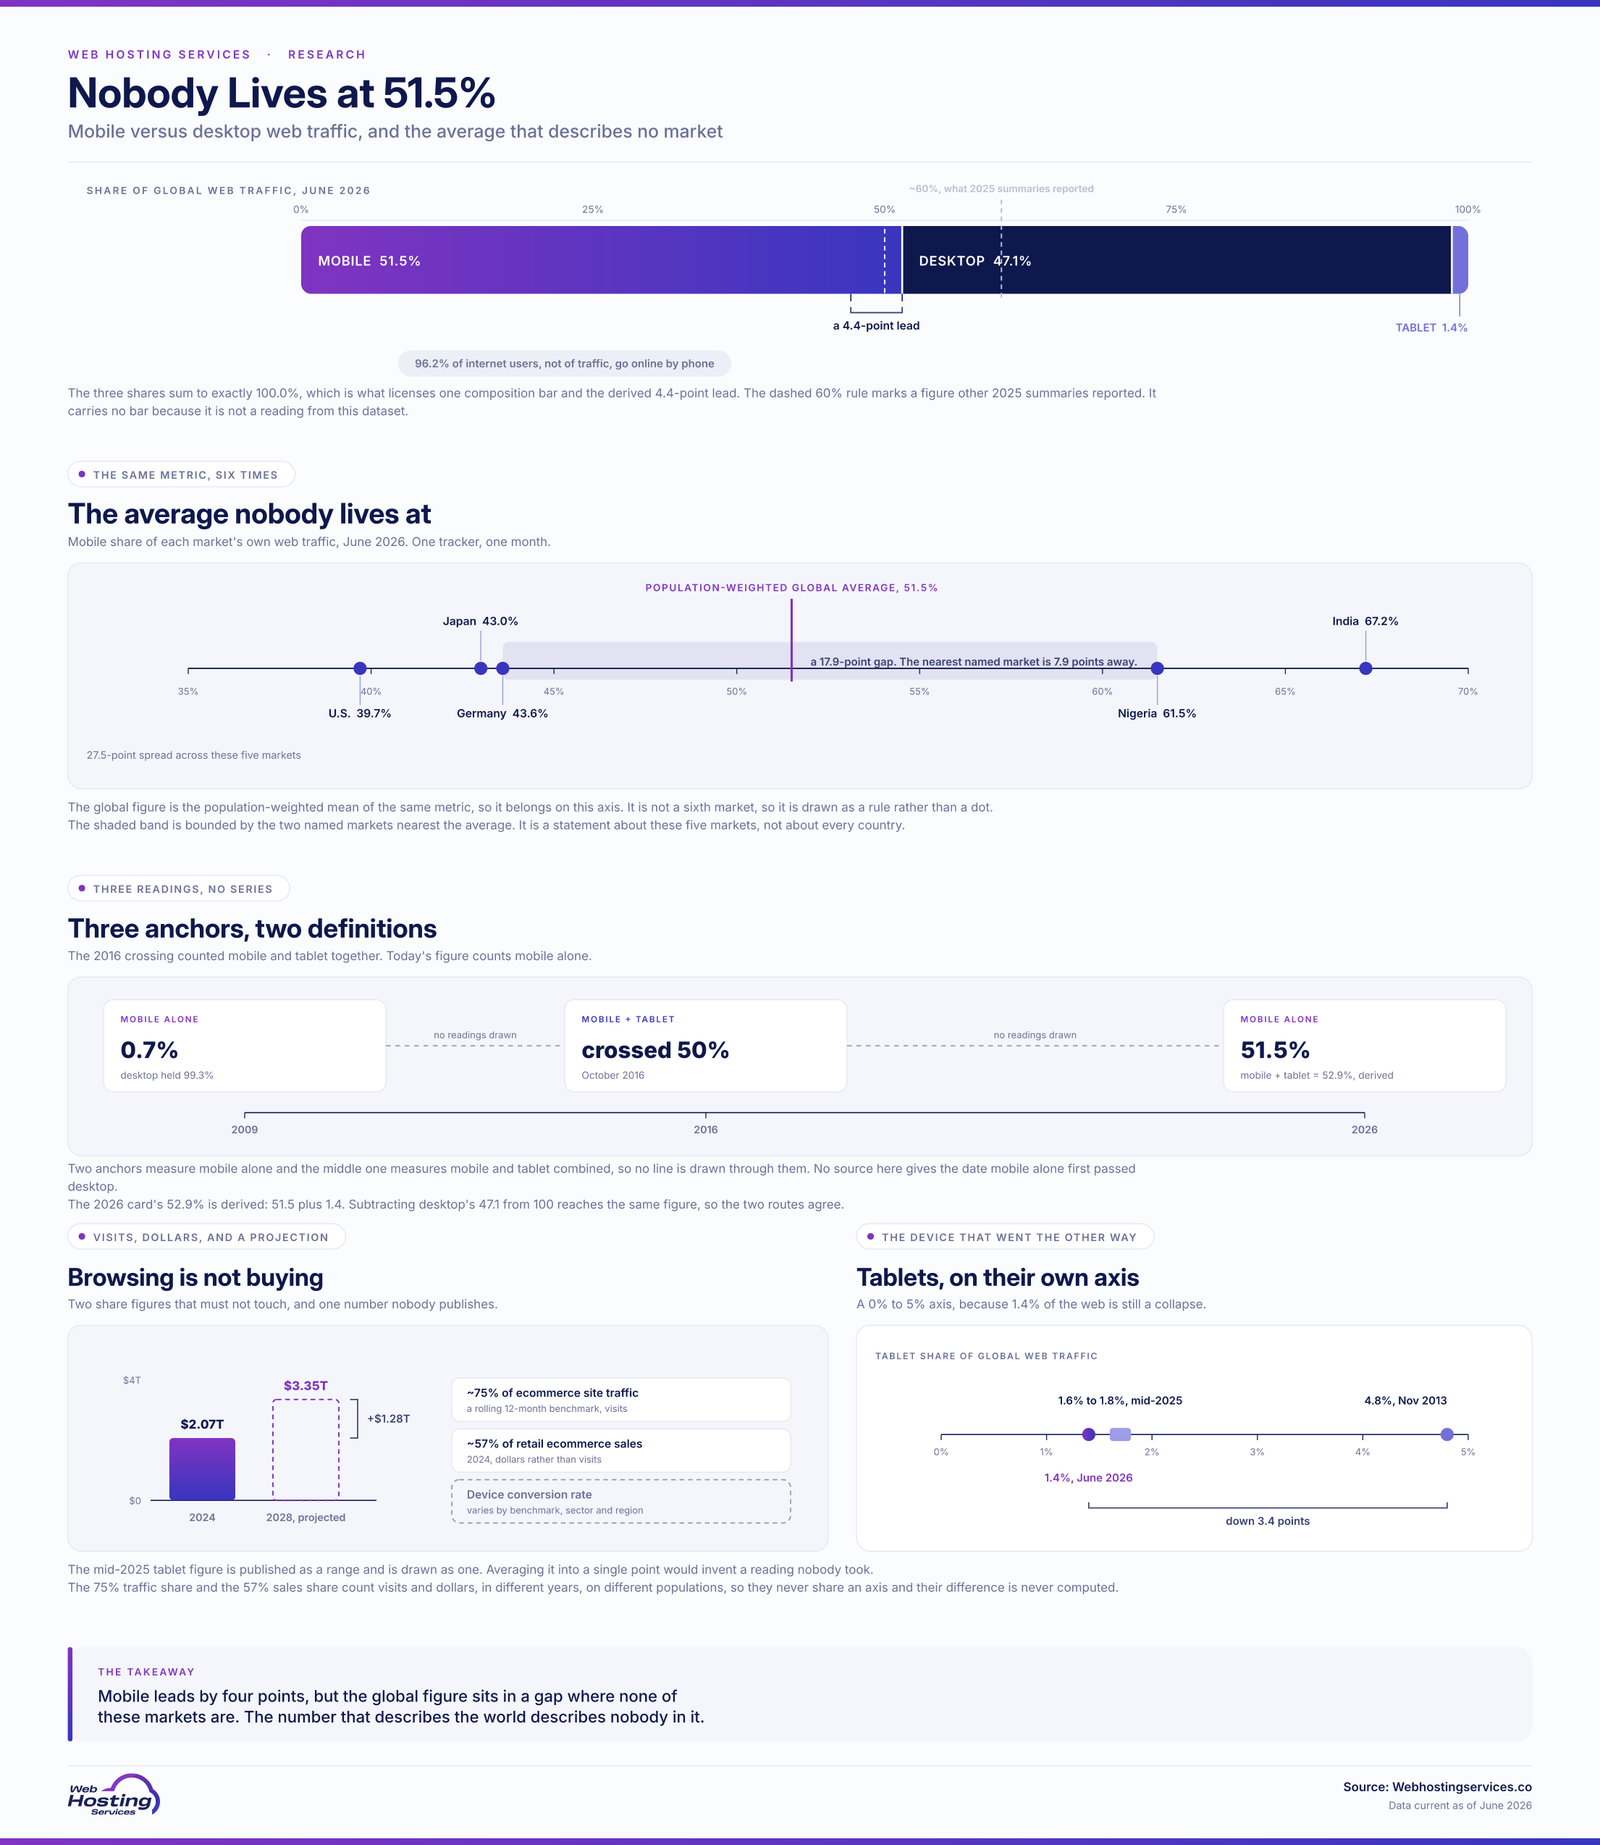
Infographic on mobile versus desktop web traffic showing mobile at 51.5%, desktop at 47.1% and tablets at 1.4%, with the global average landing in a 17.9-point gap where none of the five named markets sit.
Mobile leads by four points, but the global figure sits in a gap where none of these markets are. The number that describes the world describes nobody in it.