








DNS statistics and infrastructure
 By: Mendy Perlman
|
Updated: July 11, 2026
|
✓Fact Checked
|
By: Mendy Perlman
|
Updated: July 11, 2026
|
✓Fact Checked
|
Cite this Research
Cite this research
Perlman, M. (2026, July 11). DNS statistics and infrastructure. Web Hosting Services. https://webhostingservices.co/research/dns-statistics
Perlman, Mendy. “DNS Statistics and Infrastructure.” Web Hosting Services, 11 July 2026, https://webhostingservices.co/research/dns-statistics.
Perlman, Mendy. “DNS Statistics and Infrastructure.” Web Hosting Services. Last modified July 11, 2026. https://webhostingservices.co/research/dns-statistics.
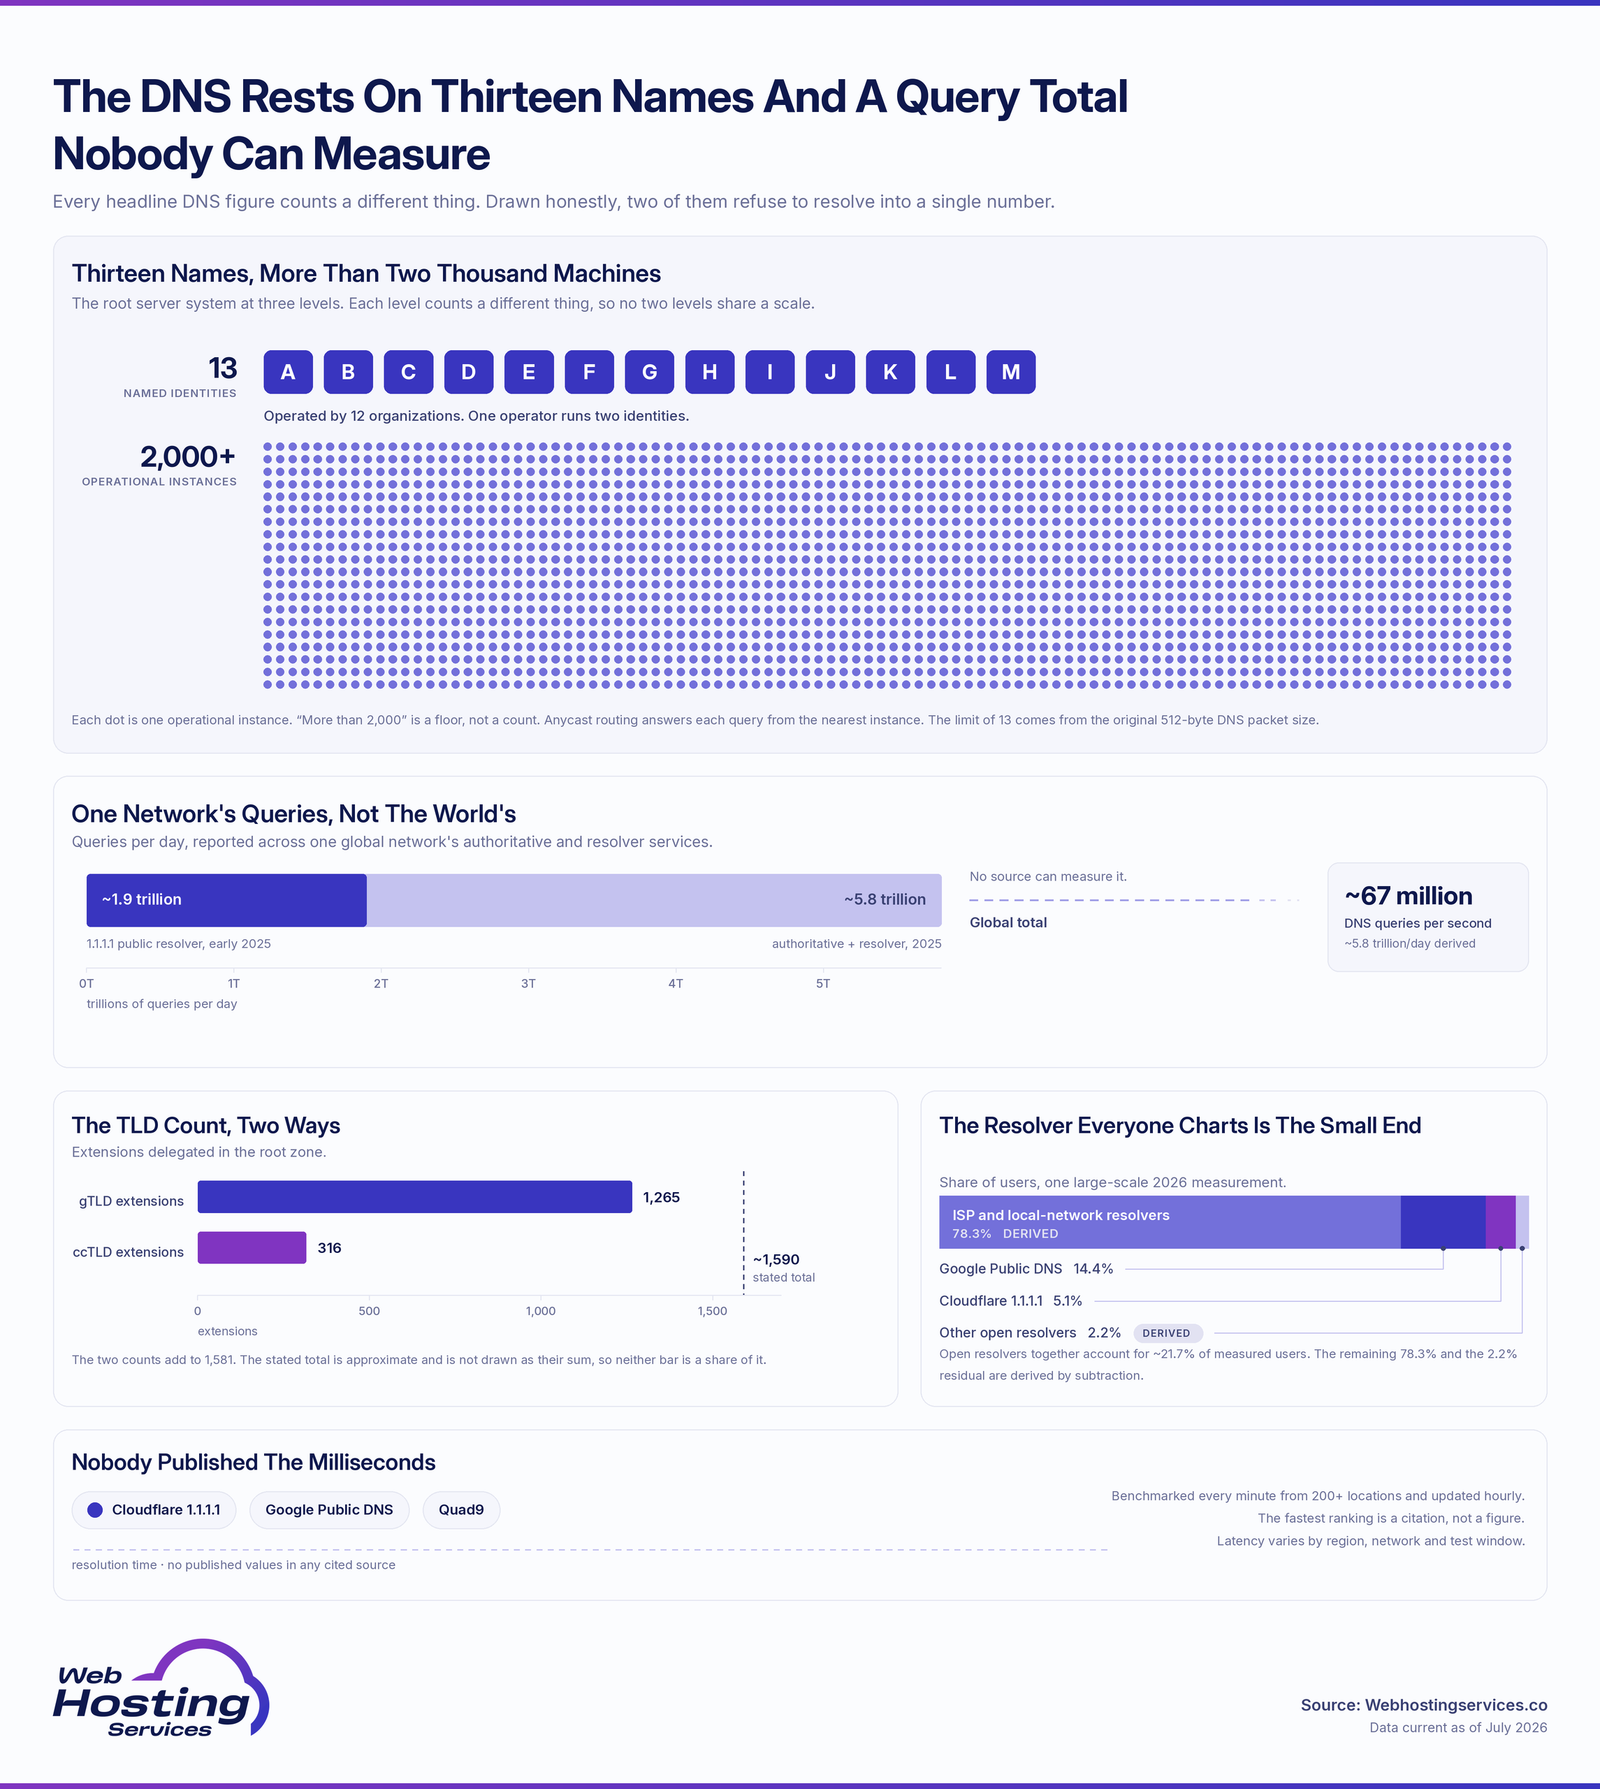
Research highlights: The DNS rests on just 13 named root server identities, operated by 12 organizations and backed by more than 2,000 operational instances worldwide. Below the root sit roughly 1,590 top-level domains delegated in the IANA root zone. Query volume is staggering: Cloudflare reported about 67 million authoritative and resolver DNS queries per second across its network, while its 1.1.1.1 public resolver averaged about 1.9 trillion queries per day in early 2025.
How many DNS root servers are there?
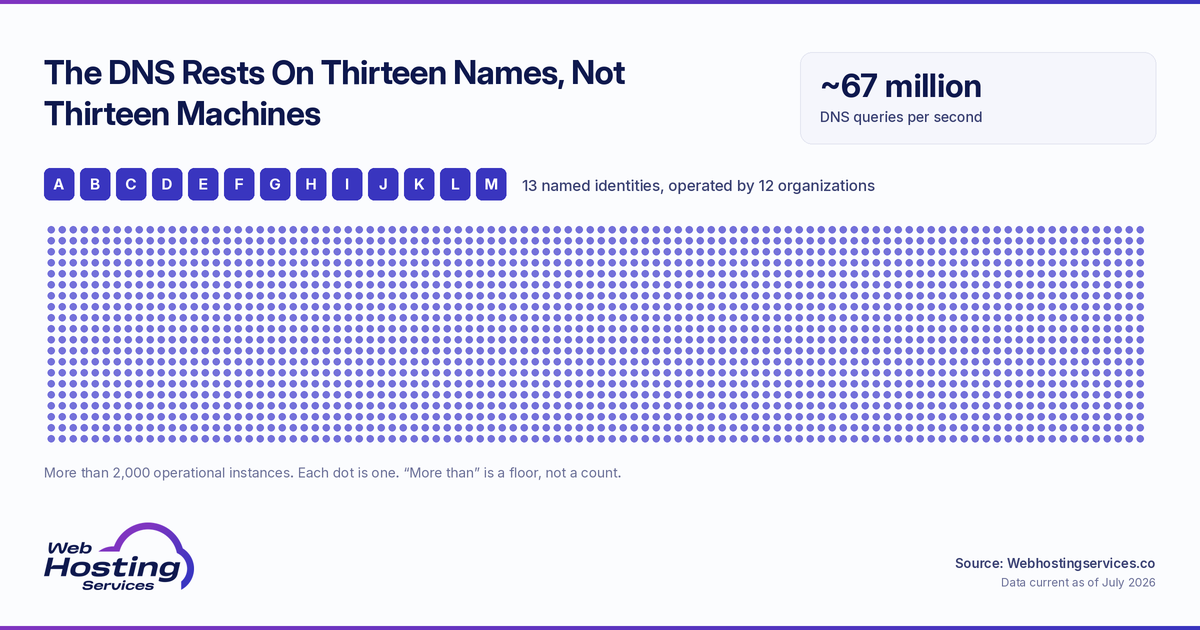
- There are 13 named root server identities, labeled A through M.
- They are operated by 12 organizations, with Verisign running two of them.
- The 13 identities are now backed by more than 2,000 operational instances worldwide.
- Those instances use Anycast routing to answer from the nearest location.
- The limit of 13 stems from the original 512-byte DNS packet size.
|
Metric |
Figure |
|
Named root identities |
13 (A through M) |
|
Operating organizations |
12 |
|
Operational instances |
2,000+ |
The “13 servers” figure is a common point of confusion. It refers to 13 named root server identities, not 13 machines. Collectively, those identities are served by thousands of anycast instances, so the root system is far more distributed than the old shorthand suggests.
How many TLDs are in the IANA root zone?
- The IANA root zone contains roughly 1,590 top-level domains.
- DNIB reports 1,265 generic TLD extensions and 316 country-code TLD extensions delegated in the root zone.
- Each TLD is served by its own set of authoritative nameservers.
- The system is managed by IANA, a function of ICANN.
- The exact count shifts as new gTLDs are added and old ones retired.
|
TLD type |
Approximate count |
|
gTLD extensions delegated in the root zone |
1,265 |
|
ccTLD extensions delegated in the root zone |
316 |
|
Total valid TLDs in IANA’s machine-readable list |
~1,590 |
TLD authoritative nameservers form the second tier of the DNS hierarchy, below the root. If a recursive resolver does not already have the relevant data cached, a query for a .com address is referred to the .com TLD nameservers, which direct it to the domain’s own authoritative servers.
How many DNS queries are made globally?
Note: no one can measure total global DNS volume precisely, so these figures illustrate scale through individual providers.
- The exact global query volume is unmeasurable, spread across countless resolvers.
- Cloudflare reported responding to about 67 million authoritative and resolver DNS queries per second across its network in its 2025 Radar Year in Review.
- That works out to roughly 5.8 trillion DNS queries per day across those Cloudflare authoritative and resolver services.
- Cloudflare’s 1.1.1.1 public resolver separately averaged about 1.9 trillion queries per day in early 2025.
- DNS is heavy-tailed, with a few popular domains drawing most of the traffic.
- Caching means most lookups never reach the root servers at all.
|
Metric |
Figure |
|
Cloudflare authoritative + resolver DNS queries |
~67 million per second, or ~5.8 trillion per day |
|
Cloudflare 1.1.1.1 resolver queries |
~1.9 trillion per day |
The global total is larger than any single provider can see, but no source can measure it precisely. Caching keeps the system efficient: most repeat lookups are answered from a nearby resolver’s cache, sparing the root and TLD servers from the full volume of user queries.
Which public DNS resolvers have the largest share?
Note: resolver share is hard to measure precisely, so these reflect general standing rather than exact figures.
- Most users worldwide still rely on ISP-provided recursive resolution, either directly or through resolver infrastructure associated with their local network.
- APNIC’s 2026 measurements put Google Public DNS first among open resolvers, at about 14.4% of users.
- Cloudflare 1.1.1.1 ranks second in APNIC’s open-resolver measurement, at about 5.1% of users.
- Open resolvers collectively account for about 21.7% of measured resolver use in APNIC’s methodology.
- Users pick public resolvers for speed, privacy, reliability and security filtering, but resolver-share estimates vary by measurement method.
|
Resolver |
Standing |
|
ISP resolvers |
Still the default for most |
|
Google Public DNS |
Largest open resolver in APNIC’s 2026 measurement (~14.4% of users) |
|
Cloudflare 1.1.1.1 |
Second open resolver in APNIC’s 2026 measurement (~5.1% of users) |
Public resolvers remain a minority choice in APNIC’s measurements. ISP and local-network recursive resolvers still handle most user resolution, while open resolvers such as Google Public DNS, Cloudflare, OpenDNS, Quad9 and regional providers serve users who choose external DNS for speed, privacy, reliability or filtering.
How fast is DNS resolution on average?
Note: resolution speeds come from DNSPerf benchmarks and vary by region and day.
- DNSPerf benchmarks public DNS resolvers every minute from more than 200 locations and updates public data hourly.
- Cloudflare says DNSPerf ranks 1.1.1.1 as the fastest DNS service in the world.
- Actual resolver latency varies by region, network, test window and resolver endpoint.
- In some locations, top public resolvers run within only a few milliseconds of each other.
- Public resolvers can outperform slower ISP DNS in some regions, but the best choice depends on the user’s location and network.
|
Measure |
What it means |
|
DNSPerf public resolver testing |
Updated hourly from 200+ locations |
|
Cloudflare 1.1.1.1 |
Frequently ranked fastest, but latency varies by region |
|
Google, Quad9 and other public resolvers |
Performance depends on location, routing and test window |
A few milliseconds per lookup sounds trivial, but a page can trigger dozens of DNS queries. Faster resolution compounds into noticeably quicker page loads, which is why switching from a slow ISP resolver is one of the simplest performance wins available.
Sources & additional resources
- Root Server Technical Operations Association. “Root Server Technical Operations.” root-servers.org.
- ICANN RSSAC. “RSSAC FAQ.” ICANN.
- IANA. “Root Zone Database.” Internet Assigned Numbers Authority.
- IANA. “Root Zone TLD List.” Internet Assigned Numbers Authority.
- ICANN. “The Root Server System.” ICANN.
- DNIB. “The Domain Name Industry Brief Q1 2026.” Domain Name Industry Brief.
- Cloudflare. “The 2025 Cloudflare Radar Year in Review.” Cloudflare Blog.
- Cloudflare. “Some TXT About, and A PTR To, New DNS Insights on Cloudflare Radar.” Cloudflare Blog.
- APNIC. “Centrality in the Internet’s Names.” APNIC Blog.
- DNSPerf. “DNS Performance Benchmarks.” DNSPerf.
- Cloudflare. “What Is 1.1.1.1?.” Cloudflare Learning Center.
- Cloudflare. “DNS Server Types Explained.” Cloudflare.
Web Hosting Services helps you understand the infrastructure behind your domain, with DNS and hosting research, hosting and domain deals and managed WordPress hosting for site owners who want help managing hosting, DNS and reliability.
Disclaimer: This article is for informational purposes only and is not legal, technical, security, business, infrastructure, domain, hosting or purchasing advice. DNS root server counts, root instance totals, TLD counts, DNS query-volume estimates, resolver-share measurements, DNS performance benchmarks, provider network data, registry information, infrastructure disclosures and measurement methodologies can change at any time and may vary by source, reporting period, definition, geography, resolver type, network path, caching behavior and methodology. Always confirm current figures, DNS requirements, registry details, resolver performance, security needs, hosting configuration and methodology directly with the cited registry, DNS operator, resolver provider, standards body, hosting provider, technical documentation or qualified professional before making domain, DNS, hosting, infrastructure, security or purchasing decisions based on DNS statistics.