









Article Contents
- 1. Hosting Speed Audit Checklist - Diagnose What Is Slowing Your Site Down
- 1.1. Download the Free Hosting Speed Audit Checklist (PDF or Word)
- 1.2. Key Takeaways
- 1.3. Step 1 - Establish Your Baseline
- 1.4. Step 2 - Audit Server Hardware and Protocol
- 1.5. Step 3 - Audit Caching Layers
- 1.6. Step 4 - Audit Server Location and CDN
- 1.7. Step 5 - Interpret Results and Prioritize Fixes
- 1.8. The Complete Hosting Speed Audit Checklist
- 1.9. Is Your Hosting Infrastructure the Bottleneck?
- 1.10. References & Additional Resources
- 1.11. Tagged In:
Hosting Speed Audit Checklist - Diagnose What Is Slowing Your Site Down
Many site speed problems are blamed on images, plugins and themes, but the hosting layer is often overlooked. This checklist audits the infrastructure foundation first so you can separate server-side bottlenecks from front-end issues.
Important Note: Hosting configurations, available caching layers, storage specifications and control panel interfaces vary significantly between providers. This checklist covers the most common hosting environments and is provided for informational purposes only. Some audit steps may require access to server configuration files or direct communication with your hosting provider. Always confirm specifications with your host before making infrastructure changes.
Download the Free Hosting Speed Audit Checklist (PDF or Word)
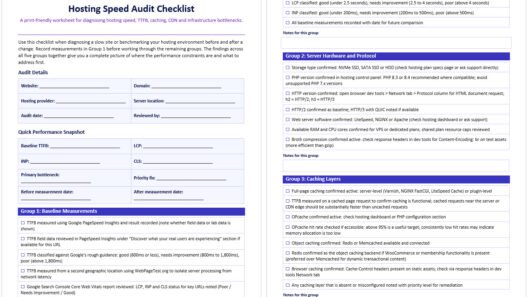
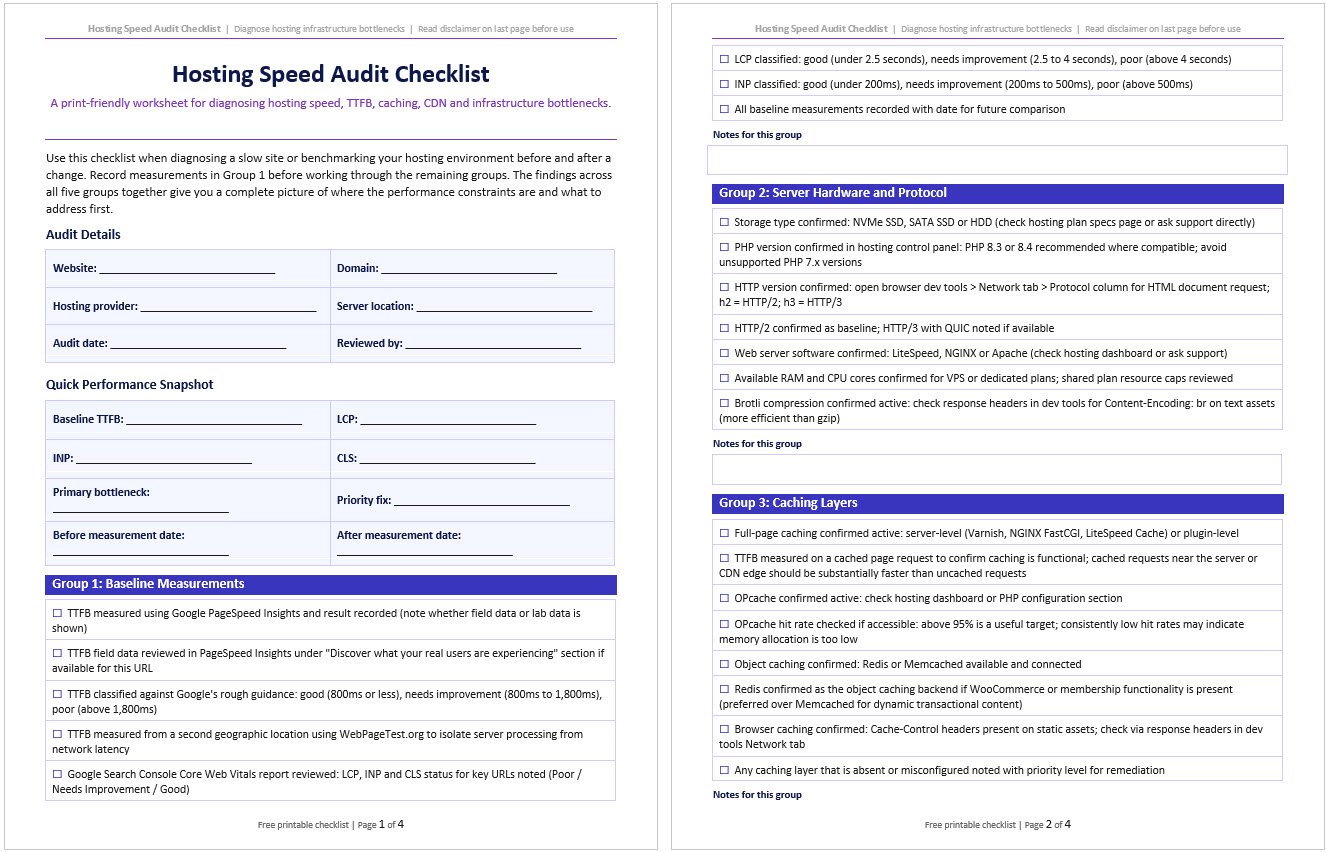
The complete checklist below is available as a free download in PDF and editable Word format. Work through it when diagnosing a slow site, print it for a structured audit session, or share it with your hosting provider when requesting a configuration review.
Both versions include all checklist items across the five audit groups, with space for recording findings and measurements. The Word version is fully editable so you can document results and track changes over time.
Key Takeaways
- TTFB above 800 milliseconds at the 75th percentile is a strong signal to investigate the hosting, caching, CDN and backend stack; front-end optimization cannot fully compensate for a consistently slow server response
- Field data from real users, including CrUX data surfaced in PageSpeed Insights and Search Console, is the best source for evaluating Core Web Vitals; Lighthouse lab scores are useful diagnostics, but field data better reflects what users experience and what Google’s page experience systems evaluate
- OPcache, Redis and full-page caching are three distinct layers each targeting a different bottleneck; for dynamic CMS sites with meaningful traffic, all three are worth checking and configuring
- NVMe SSD storage usually delivers higher throughput and lower latency than SATA SSD storage; the difference is most noticeable on database-heavy, uncached or high-I/O workloads
- HTTP/3 with QUIC can reduce connection setup latency and avoid TCP-level head-of-line blocking; it is a meaningful infrastructure differentiator worth confirming in 2026
- Server location relative to your primary audience creates unavoidable network latency that no amount of front-end optimization can eliminate; geographic distance is a physics constraint, not a configuration problem
Most speed optimization guides start with image compression, minification and caching plugins. Those matter. But they operate downstream of the hosting infrastructure.
If the server is the actual bottleneck, front-end optimization improves performance on a slow foundation rather than addressing the root cause. The gains are real but limited, and they plateau quickly.
This checklist audits the hosting environment as the source of speed problems before moving to application-layer fixes.
It covers server hardware specifications, caching layer configuration, geographic server placement, CDN setup and the performance metrics that reveal what the infrastructure is actually delivering to real users.
It is distinct from the monthly hosting maintenance routine (which covers recurring tasks) and from a WordPress-specific performance checklist (which addresses platform configuration). This is a one-time or periodic infrastructure diagnostic.
The relationship between hosting infrastructure and page load times is covered in depth in how your hosting environment affects website speed.
If the audit reveals that your current plan cannot meet your performance requirements, how to match a hosting plan to your site’s actual needs covers the upgrade decision.
Step 1 - Establish Your Baseline
Before changing anything, measure what your hosting environment is actually delivering.
This baseline is what you compare against after any infrastructure change. Without it, you cannot tell whether a change made a meaningful difference or just moved a number within normal variation.
TTFB measurement
According to Google’s guidance on TTFB, 800 milliseconds or less at the 75th percentile is the rough target; between 800ms and 1,800ms needs improvement; above 1,800ms is poor.
These thresholds apply to the full navigation TTFB including DNS lookup, TCP connection, TLS handshake and server processing time combined.
TTFB is not itself a Core Web Vital but it directly influences your LCP ceiling: a server that takes 1,500ms to respond leaves very little room to achieve an LCP under 2.5 seconds, especially without effective caching or edge delivery in front of the origin.
The most important distinction when measuring TTFB is field data versus lab data.
Field data comes from real Chrome users and is collected via the Chrome User Experience Report (CrUX). It appears in PageSpeed Insights under the “Discover what your real users are experiencing” section.
Lab data is a synthetic Lighthouse test run at the moment you click the button.
Lab scores are useful for diagnosing issues but field data better reflects what users experience and what Google’s page experience systems evaluate. Always check field data first if it is available for your URL.
Core Web Vitals in Google Search Console
Open the Core Web Vitals report in GSC and review your URLs classified as Poor, Needs Improvement and Good.
The three signals to review are loading performance (LCP, where under 2.5 seconds is the good threshold), responsiveness (INP, where under 200 milliseconds is good) and visual stability (CLS, where under 0.1 is good).
Google’s Core Web Vitals documentation confirms that each metric is assessed at the 75th percentile of real user sessions rather than as an average.
A poor LCP in the GSC report that coincides with a high TTFB measurement is a strong signal that the hosting environment is a contributing constraint.
Test from multiple geographic locations
TTFB measured from a server close to your origin will look better than TTFB measured from a region far away.
Use WebPageTest.org to run tests from specific geographic locations and compare results.
A large gap between TTFB measured from a nearby location versus a distant one confirms that geographic latency is a contributing factor rather than server processing time alone.
Record all baseline measurements before proceeding.
TTFB from two or three geographic locations, field LCP from PageSpeed Insights if available, and GSC Core Web Vitals status for your key pages. These numbers are what the rest of the audit is designed to explain.

Step 2 - Audit Server Hardware and Protocol
Two hosting plans can have identical resource allocations on paper and deliver meaningfully different performance because of the underlying hardware. These are the specifications worth auditing directly.
Storage type
NVMe SSD, SATA SSD and HDD are not equivalent.
As IBM’s comparison of NVMe and SATA explains, NVMe SSDs generally deliver higher throughput and lower latency than SATA SSDs because NVMe uses the PCIe interface to communicate directly with the CPU rather than routing through the older SATA protocol.
The practical difference is most noticeable on database-heavy, uncached or high-I/O workloads, though actual TTFB impact depends on the full server stack including caching, query complexity and available memory.
To confirm your storage type: check your hosting plan’s specifications page, or contact support directly and ask.
If the provider cannot tell you what storage type your account is on, that absence of transparency is itself useful information.
PHP version
PHP 8.x generally performs better than PHP 7.x and is the supported path for modern WordPress environments.
As the PHP supported versions page confirms, PHP 8.2 is security-only support and reaches end of life in December 2026, while PHP 8.3 receives security support through December 2027 and PHP 8.4 is the newer supported branch.
In 2026, PHP 8.3 or 8.4 is a better target than PHP 8.2 where your site and plugins support it.
Check your current PHP version in the hosting control panel and test on staging before upgrading, as some older plugins and themes can have compatibility issues.
HTTP version
HTTP/2 multiplexes multiple requests over a single connection and removes much of the request-level inefficiency of HTTP/1.1, though it still runs over TCP.
HTTP/3 uses QUIC, which can reduce connection setup latency and avoid TCP-level head-of-line blocking, especially on high-latency or lossy networks.
To check which HTTP version your server supports: open your browser’s developer tools, go to the Network tab, reload the page and look at the Protocol column for your HTML document request.
Values of h2 confirm HTTP/2; h3 confirms HTTP/3. HTTP/2 is the baseline standard in 2026; HTTP/3 with QUIC is now widely available on modern hosting stacks and worth confirming.
Brotli compression
Brotli is worth checking for text-based assets such as HTML, CSS and JavaScript. It generally compresses better than gzip and can reduce transfer size for compatible browsers.
In browser developer tools, check response headers for Content-Encoding: br on text assets.
If you see Content-Encoding: gzip instead, your server is not using Brotli, which may be a configuration option worth enabling if available on your plan.
Web server software
LiteSpeed, NGINX and Apache can all perform well when configured properly, but they handle caching and concurrency differently.
LiteSpeed is popular in WordPress hosting because of its native LiteSpeed Cache integration, which delivers server-level caching without additional configuration.
NGINX is commonly used for efficient static content delivery and reverse proxy setups.
Apache remains widely used and flexible, but poorly configured Apache environments can struggle under high concurrency.
Web server software is generally not something shared hosting customers can change without switching providers, but it is worth noting as a contributing factor when performance problems persist under load.
Step 3 - Audit Caching Layers
Caching is not a single setting. It is a stack of distinct layers each targeting a different point in the request cycle.
For dynamic CMS sites with meaningful traffic, all three layers are worth checking and configuring. The absence of any one layer leaves a specific bottleneck unaddressed regardless of how well the others are configured.
Full-page caching
This is the highest-impact caching layer for most sites.
It stores a complete rendered HTML copy of each page and delivers it to subsequent visitors without executing PHP or querying the database at all. An uncached WordPress page can take hundreds of milliseconds to generate, especially on plugin-heavy or database-heavy sites.
A properly configured full-page cache can reduce server processing dramatically because WordPress does not need to bootstrap for every request.
Server-level full-page caching (Varnish, NGINX FastCGI Cache, LiteSpeed Cache) often outperforms plugin-based caching because it can intercept requests before WordPress loads, reducing PHP execution overhead.
Confirm whether full-page caching is active at the server level, at the plugin level or not at all.
OPcache
OPcache stores compiled PHP bytecode in memory.
Without it, the server reads PHP files from disk, verifies syntax and compiles them to machine code on every request.
With OPcache active, subsequent requests skip the read and compilation step entirely and execute from RAM.
OPcache has little downside in normal production environments and should usually be active on PHP hosting.
To verify it is running: check your hosting dashboard for a PHP configuration section, or look at a phpinfo() output if you can create a temporary file.
The key metric to check is the hit rate; an OPcache hit rate consistently below 95% may indicate the memory allocation is too low relative to your codebase size and is worth raising.
I have seen OPcache listed as active in a hosting dashboard but delivering a low hit rate because the memory_consumption setting was left at its default value from years earlier, which was too low for the number of PHP files the site had accumulated.
Confirming it is enabled is step one; confirming the hit rate is actually high is step two.
Object caching | Redis or Memcached
WordPress’s default object cache lives in memory only for the duration of a single request.
Every subsequent page load re-runs the same database queries from scratch.
A persistent object cache (Redis or Memcached) stores the results of those queries in RAM across requests, reducing repeated database queries significantly on sites where the same objects, options, transients or query results are requested across page loads.
Redis and Memcached serve the same function but differ in capability.
Redis supports richer data structures, persistence to disk and atomic operations, making it the preferred option for WooCommerce (cart state, session data, transients) and membership sites.
Memcached can still be effective for simpler object caching needs.
For many WordPress sites in 2026, Redis is the preferred choice where available, especially for WooCommerce, membership and dynamic sites.
Full-page caching and OPcache should usually be active regardless of site type; persistent object caching becomes especially valuable as database complexity and traffic grow.
To verify: check whether your hosting plan includes Redis; if so, confirm it is connected via the Redis Object Cache plugin or your host’s native configuration.
If your host does not offer Redis, that is a signal worth factoring into your hosting plan evaluation.
For context on what managed hosting plans typically include at the caching layer, what managed hosting covers and who it suits is worth reviewing.

Step 4 - Audit Server Location and CDN
Network latency from geographic distance compounds with every other source of TTFB.
A server that is well-configured with NVMe storage, OPcache, Redis and full-page caching can still add meaningful round-trip latency if it is serving visitors on a different continent.
Identify your server location
Check your hosting dashboard for data center location information or use an IP geolocation tool with your server IP address.
If your host provides multiple data center regions, confirm which one your account is actually on rather than which ones the provider advertises.
Compare against your audience location
Open Google Analytics and check the geographic distribution of your sessions over the last 30 days.
If the majority of your visitors are in a specific country or region and your server is on a different continent, geographic latency is a contributing factor to your TTFB.
For most sites with a concentrated audience, being on the right continent matters more than specific country; for sites where performance precision matters, a regional match is worth pursuing.
Audit CDN configuration
A CDN reduces geographic latency for static assets and, on platforms like Cloudflare, can also cache full HTML pages at edge locations close to visitors.
To confirm a CDN is active and serving content: open your browser’s developer tools, go to the Network tab, reload the page and click on a static asset (an image or CSS file).
Look at the Response Headers for cache-status indicators: CF-Cache-Status: HIT on Cloudflare means the asset was served from an edge cache; X-Cache: Hit on other providers indicates the same.
A value of MISS means the CDN fetched the asset from your origin server on that request, which is normal for the first request but should be HIT on subsequent requests for the same asset from the same edge location.
Confirm what the CDN is actually caching
CDNs should be caching static assets: images, CSS, JavaScript and web fonts.
They should not be caching authenticated pages, shopping cart pages or any personalized content without careful configuration. Also confirm which image formats are being served.
In 2026, WebP is supported by all major browsers and should be served where available.
AVIF offers additional compression gains and browser support has grown significantly. If your CDN or image optimization layer is still serving JPEG for all images without format negotiation, that is a compression opportunity worth addressing at the delivery layer.
Check CDN edge coverage against your audience geography
A CDN with edge nodes primarily in North America is less effective for a site with significant European or APAC traffic than one with a distributed global network.
Confirm your CDN provider has points of presence in the regions where your audience concentrates.
Cloudflare’s caching documentation is a useful reference for understanding how cache rules, edge behavior and cache hit ratios work in practice.

Step 5 - Interpret Results and Prioritize Fixes
The audit produces a picture of which layers are working and which are not.
The triage framework for prioritizing fixes is straightforward: address server-layer problems first because they affect every single request.
CDN and delivery improvements come second because they reduce load on a properly configured origin.
Application-layer optimizations (image compression, script deferral, CSS optimization) come third and layer on top of a solid infrastructure foundation.
If TTFB is elevated on cached requests near your server location, the problem is likely in the server configuration: missing full-page caching, OPcache misconfiguration, insufficient RAM or an overloaded shared environment.
Cached requests tested near the server or from a nearby CDN edge should be substantially faster than uncached requests in well-configured environments.
If they are not, no amount of image optimization will move you to a good LCP score.
If TTFB is acceptable near the server but high from distant locations, the problem is geographic.
The fix is CDN configuration (for static assets and potentially full HTML caching) or a server region migration.
If you are evaluating whether your current plan has the headroom to support better performance or whether an upgrade is the right path, matching your hosting plan to your site’s real resource requirements covers that decision in detail.
If the audit points to a full hosting migration as the right outcome, the hosting migration checklist covers that process from start to finish.
If caching layers are missing or misconfigured, the priority order for implementation is: full-page caching first (highest impact on TTFB for all visitors), then OPcache (reduces PHP compilation overhead on every dynamic request), then Redis object caching (reduces database query load for repeat requests).
Each layer can be implemented independently, so starting with full-page caching delivers the largest measurable improvement while the others are being configured.

The Complete Hosting Speed Audit Checklist
Use this checklist when diagnosing a slow site or benchmarking your hosting environment before and after a change.
Record measurements in Group 1 before working through the remaining groups. The findings across all five groups together give you a complete picture of where the performance constraints are and what to address first.
This checklist is available as a free downloadable PDF and editable Word document above at Web Hosting Services.
Group 1: Baseline Measurements
- ☐ TTFB measured using Google PageSpeed Insights and result recorded (note whether field data or lab data is shown)
- ☐ TTFB field data reviewed in PageSpeed Insights under “Discover what your real users are experiencing” section if available for this URL
- ☐ TTFB classified against Google’s rough guidance: good (800ms or less), needs improvement (800ms to 1,800ms), poor (above 1,800ms)
- ☐ TTFB measured from a second geographic location using WebPageTest.org to isolate server processing from network latency
- ☐ Google Search Console Core Web Vitals report reviewed: LCP, INP and CLS status for key URLs noted (Poor / Needs Improvement / Good)
- ☐ LCP reviewed: good threshold is under 2.5 seconds; needs improvement up to 4 seconds; poor above 4 seconds
- ☐ INP reviewed: good threshold is under 200ms; needs improvement up to 500ms; poor above 500ms
- ☐ All baseline measurements recorded with date for future comparison
Group 2: Server Hardware and Protocol
- ☐ Storage type confirmed: NVMe SSD, SATA SSD or HDD (check hosting plan specs page or ask support directly)
- ☐ PHP version confirmed in hosting control panel: PHP 8.3 or 8.4 recommended where compatible; avoid unsupported PHP 7.x versions
- ☐ HTTP version confirmed: open browser dev tools > Network tab > Protocol column for HTML document request; h2 = HTTP/2; h3 = HTTP/3
- ☐ HTTP/2 confirmed as baseline; HTTP/3 with QUIC noted if available
- ☐ Web server software confirmed: LiteSpeed, NGINX or Apache (check hosting dashboard or ask support)
- ☐ Available RAM and CPU cores confirmed for VPS or dedicated plans; shared plan resource caps reviewed
- ☐ Brotli compression confirmed active: check response headers in dev tools for Content-Encoding: br on text assets (more efficient than gzip)
Group 3: Caching Layers
- ☐ Full-page caching confirmed active: server-level (Varnish, NGINX FastCGI, LiteSpeed Cache) or plugin-level
- ☐ TTFB measured on a cached page request to confirm caching is functional; cached requests near the server or CDN edge should be substantially faster than uncached requests
- ☐ OPcache confirmed active: check hosting dashboard or PHP configuration section
- ☐ OPcache hit rate checked if accessible: above 95% is a useful target; consistently low hit rates may indicate memory allocation is too low
- ☐ Object caching confirmed: Redis or Memcached available and connected
- ☐ Redis confirmed as the object caching backend if WooCommerce or membership functionality is present (preferred over Memcached for dynamic transactional content)
- ☐ Browser caching confirmed: Cache-Control headers present on static assets; check via response headers in dev tools Network tab
- ☐ Any caching layer that is absent or misconfigured noted with priority level for remediation
Group 4: Server Location and CDN
- ☐ Server location confirmed from hosting dashboard or IP geolocation tool
- ☐ Primary audience location confirmed from Google Analytics > Reports > Demographics > Overview (last 30 days)
- ☐ Geographic match assessed: server and primary audience on same continent; significant mismatch noted as contributing latency factor
- ☐ CDN active status confirmed: response headers checked for CF-Cache-Status or X-Cache on static assets in browser dev tools
- ☐ CDN cache hit confirmed for static assets: CF-Cache-Status: HIT or X-Cache: Hit visible on repeat requests
- ☐ CDN edge coverage reviewed against primary audience geography: provider has points of presence in audience regions
- ☐ Image format delivery confirmed: WebP or AVIF being served to compatible browsers where available (check image response headers in dev tools for Content-Type: image/webp or image/avif)
- ☐ Image compression confirmed active: large uncompressed images flagged in PageSpeed Insights Opportunities section
- ☐ CDN caching scope confirmed: authenticated pages and cart flows are not being cached incorrectly
Group 5: Audit Results and Next Steps
- ☐ Primary bottleneck identified: server hardware, caching configuration, geographic latency, CDN gaps or application layer
- ☐ Triage priority confirmed: server-layer fixes scheduled first; CDN improvements second; application-layer optimizations third
- ☐ Caching gaps remediated or scheduled: full-page caching, OPcache, Redis in priority order
- ☐ PHP version upgrade scheduled if currently on 7.x or 8.2 and staging environment confirmed for testing
- ☐ Server region migration assessed if geographic mismatch is significant and CDN is not sufficient to close the gap
- ☐ Hosting plan upgrade assessed if current plan cannot support required caching layers or resource levels
- ☐ Post-remediation TTFB and Core Web Vitals measured and compared against Group 1 baseline
- ☐ Results documented: findings, changes made, before and after measurements recorded
Is Your Hosting Infrastructure the Bottleneck?
Running this audit often surfaces the same pattern: a site that has been heavily optimized at the application layer is still slow because the hosting environment was never properly configured.
Missing caching layers, outdated PHP versions, SATA storage on a database-heavy site and a server on the wrong continent are all fixable infrastructure problems.
They are also problems that front-end optimization cannot compensate for.
At Web Hosting Services, performance audits and hosting environment optimization are among the most common things we help businesses with.
If you have worked through this checklist and identified gaps, or if you want an expert to run through it on your behalf and tell you exactly what is constraining your site’s performance, contact us and describe your current setup.
We will tell you what is slowing your site down and what it would take to fix it.
References & Additional Resources
- Google. “Time to First Byte (TTFB).” web.dev.
- Google. “Understanding Core Web Vitals and Google Search Results.” Google Search Central.
- Cloudflare. “Cloudflare Cache.” Cloudflare Developer Documentation.
- WebPageTest. “WebPageTest Speed Test.”
- Google. “PageSpeed Insights.”
- Google. “Chrome User Experience Report.” Chrome for Developers.
- PHP. “Supported Versions.” PHP Documentation.
- PHP. “OPcache.” PHP Manual.
- IBM. “NVMe vs SATA.” IBM Think.
- MDN Web Docs. “Content-Encoding.” MDN Web Docs.
- MDN Web Docs. “Image File Type and Format Guide.” MDN Web Docs.
- HTTP.dev. “HTTP/3 Explained.”
- Can I Use. “AVIF Image Format.”