



Website accessibility statistics
Cite this Research
Cite this research
Perlman, M. (2026, July 8). Website accessibility statistics. Web Hosting Services. https://webhostingservices.co/research/website-accessibility-statistics
Perlman, Mendy. “Website Accessibility Statistics.” Web Hosting Services, 8 July 2026, https://webhostingservices.co/research/website-accessibility-statistics.
Perlman, Mendy. “Website Accessibility Statistics.” Web Hosting Services. Last modified July 8, 2026. https://webhostingservices.co/research/website-accessibility-statistics.
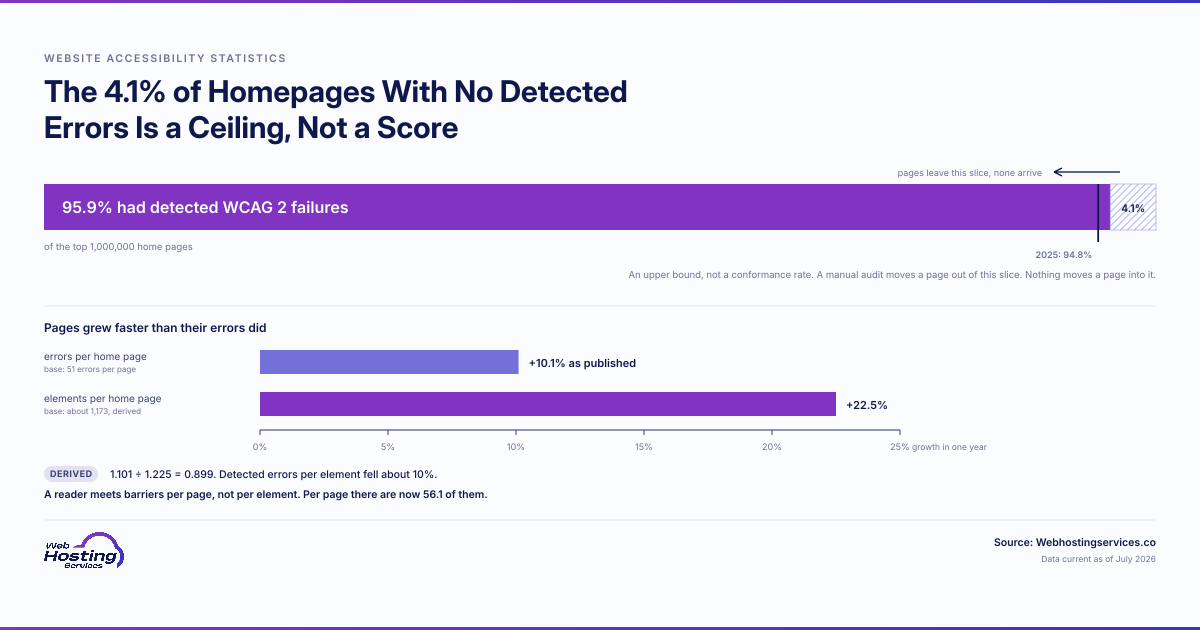
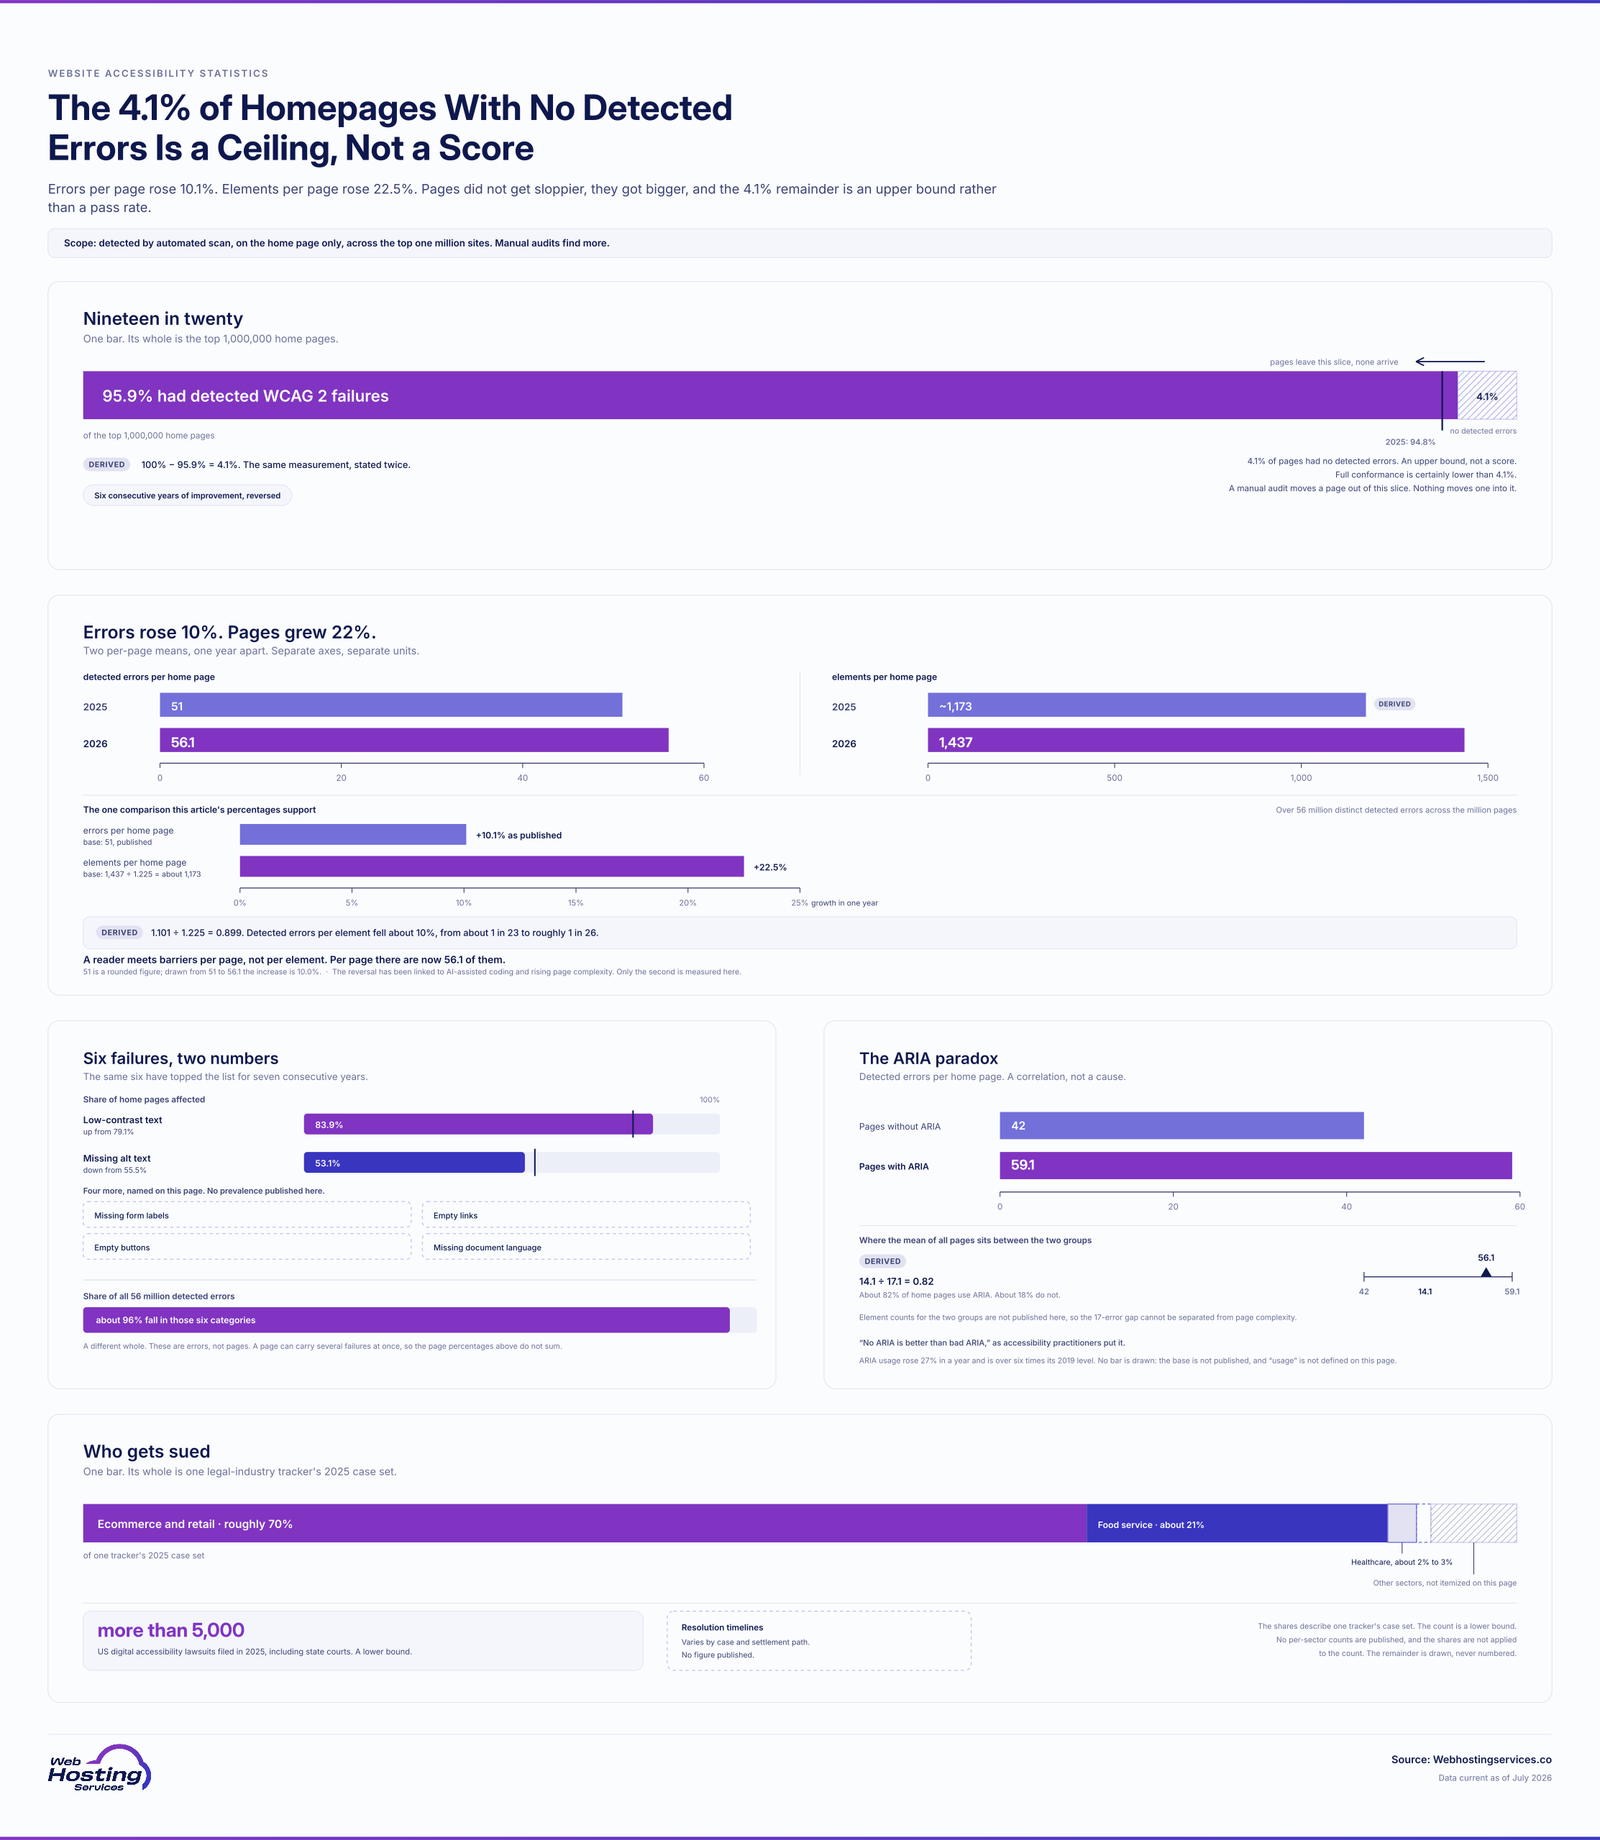
Research highlights: A striking 95.9% of the top one million homepages have detectable accessibility failures. Pages average 56.1 errors each, up 10.1% in a year, reversing six years of slow progress. Just six issue types cause about 96% of all failures, and low-contrast text alone affects 83.9% of pages. Meanwhile, thousands of accessibility lawsuits are filed each year.
What percentage of websites have accessibility errors?
- 95.9% of the top one million homepages have detectable WCAG failures.
- That figure rose from 94.8% the year before, a step backward.
- Full WCAG 2 A/AA conformance was certainly lower than 4.1% of pages.
- The 2026 result reversed six years of gradual improvement.
- Automated scans catch only a fraction of what manual audits would find.
|
Metric |
Figure |
|
Homepages with WCAG failures |
95.9% |
|
Upper bound on full conformance |
Under 4.1% |
|
Change from prior year |
Worse |
The scale of the problem is hard to overstate. When fewer than one in twenty top homepages passes even an automated scan, accessibility is not an edge case for a few sites, it is a near-universal gap affecting the entire web.
What is the average number of accessibility errors per page?
- Homepages averaged 56.1 detectable accessibility errors each in 2026.
- That is up 10.1% from 51 errors per page the year before.
- Across one million pages, over 56 million distinct errors were found.
- Roughly 1 in 26 page elements has a detectable error.
- Page complexity jumped 22.5% in a year, to 1,437 elements per page.
|
Metric |
Figure |
|
Errors per page |
56.1 |
|
Year-over-year change |
+10.1% |
|
Elements per page |
1,437 |
Rising complexity is the engine behind the decline. As pages pack in more elements, third-party frameworks and AI-assisted code, the surface area for errors grows faster than teams fix them, so the per-page count keeps climbing.
What are the most common website accessibility failures?
- Low-contrast text is the most common issue, affecting 83.9% of pages, up from 79.1% the year before.
- Missing alternative text on images affects 53.1% of pages, down slightly from 55.5%.
- The rest of the top six are missing form labels, empty links, empty buttons and missing document language.
- Just six categories account for about 96% of all detected errors.
- These same six have topped the list for seven consecutive years.
|
Failure |
Pages affected |
|
Low-contrast text |
83.9% |
|
Missing alt text |
53.1% |
|
Top six categories |
~96% of all errors |
The encouraging flip side is how fixable this is. These are not obscure technical edge cases but the basics, and because six issues drive nearly all failures, targeted attention to them would dramatically improve accessibility across the whole web.
How many homepages meet WCAG conformance?
- Full WCAG 2 A/AA conformance was certainly under 4.1% of homepages.
- Pages using ARIA averaged more errors (59.1) than those without it (42).
- ARIA usage itself rose 27% in a single year and is over six times higher than in 2019.
- As accessibility practitioners put it, “no ARIA is better than bad ARIA.”
- Manual audits uncover far more issues than automated scans alone.
|
Metric |
Figure |
|
Upper bound on full conformance |
Under 4.1% |
|
Errors with ARIA vs without |
59.1 vs 42 |
The ARIA paradox is a useful warning. Code meant to improve accessibility often makes it worse when applied carelessly, which is why well-built simple markup usually beats complex markup patched with accessibility attributes.
How is web accessibility trending year over year?
- 2026 reversed six straight years of slow improvement.
- Errors per page rose from 51 to 56.1, a 10.1% jump.
- The WCAG failure rate climbed from 94.8% to 95.9%.
- Progress over the prior several years had been modest even before this reversal.
- The reversal is linked to AI-assisted coding and rising page complexity.
|
Year |
Errors per page |
|
2025 |
51 |
|
2026 |
56.1 |
The trend line is the real warning. After years of inching forward, the web is now sliding backward on accessibility, suggesting that faster, more automated development is outpacing the care needed to keep sites usable for everyone.
How many web accessibility lawsuits are filed each year?
Note: lawsuit counts come from legal-industry trackers like UsableNet and vary by year and methodology.
- More than 5,000 digital accessibility lawsuits were filed in the US in 2025, including state courts.
- Ecommerce and retail sites remain the most common target, at roughly 70% of cases.
- Food service follows at about 21%, with healthcare representing about 2% to 3% of cases in UsableNet’s 2025 data.
- The Supreme Court’s 2019 decision not to hear Domino’s Pizza’s appeal left in place a Ninth Circuit ruling that Title III of the ADA can apply to websites and apps connected to physical places of public accommodation.
- Resolution timelines vary widely depending on whether a case settles quickly, proceeds through litigation or requires remediation commitments.
|
Metric |
Figure |
|
Annual US lawsuits (2025, incl. state courts) |
5,000+ |
|
Ecommerce and retail share of cases |
~70% |
|
Resolution timeline |
Varies by case and settlement path |
Accessibility is now a legal and financial risk, not just an ethical one. With thousands of suits filed yearly and online stores the top target, the basics of WCAG compliance have become a practical safeguard for any business operating on the web. See our ecommerce platform research.
Sources & additional resources
- WebAIM. “The WebAIM Million: Accessibility of the Top 1,000,000 Home Pages.” WebAIM.
- UsableNet. “ADA Web Lawsuit Trends for 2026: What 2025 Filings Reveal.” UsableNet.
- Searchlab. “Digital Accessibility Statistics 2026.” Searchlab.
- Nexer Digital. “The WebAIM Million Report 2026: What It Tells Us.” Nexer Digital.
- W3C. “Web Content Accessibility Guidelines (WCAG).” W3C Web Accessibility Initiative.
- W3C WAI. “Read Me First: No ARIA Is Better Than Bad ARIA.” W3C Web Accessibility Initiative.
- Seyfarth Shaw LLP. “Supreme Court Declines to Review Ninth Circuit Decision in Robles v. Domino’s.” ADA Title III.
Web Hosting Services helps you build a site that works for everyone, with independent accessibility and hosting research, current hosting deals and managed WordPress hosting with managed updates, backups, a built-in CDN, firewalls, malware scanning and tuned servers.
Disclaimer: This article is for informational purposes only and is not legal, technical, accessibility-compliance, ADA, WCAG, financial, business, hosting or purchasing advice. Website accessibility statistics, WCAG failure rates, automated scan results, error counts, ARIA findings, lawsuit data, conformance estimates, accessibility trend reporting, legal-industry trackers and third-party methodologies can change at any time and may vary by source, reporting period, website sample, page type, testing tool, manual-audit coverage, jurisdiction, legal standard and measurement definition. Always confirm current accessibility requirements, compliance obligations, remediation priorities, legal risks, audit results, hosting needs and methodology directly with the cited source, accessibility specialist, legal advisor, web developer, testing provider, hosting provider or qualified professional before making website accessibility, compliance, development, hosting, business or purchasing decisions based on website accessibility statistics.