





Average web page size and performance benchmarks
Cite this Research
Cite this research
Perlman, M. (2026, July 14). Average web page size and performance benchmarks. Web Hosting Services. https://webhostingservices.co/research/average-web-page-size
Perlman, Mendy. “Average Web Page Size and Performance Benchmarks.” Web Hosting Services, 14 July 2026, https://webhostingservices.co/research/average-web-page-size.
Perlman, Mendy. “Average Web Page Size and Performance Benchmarks.” Web Hosting Services. Last modified July 14, 2026. https://webhostingservices.co/research/average-web-page-size.
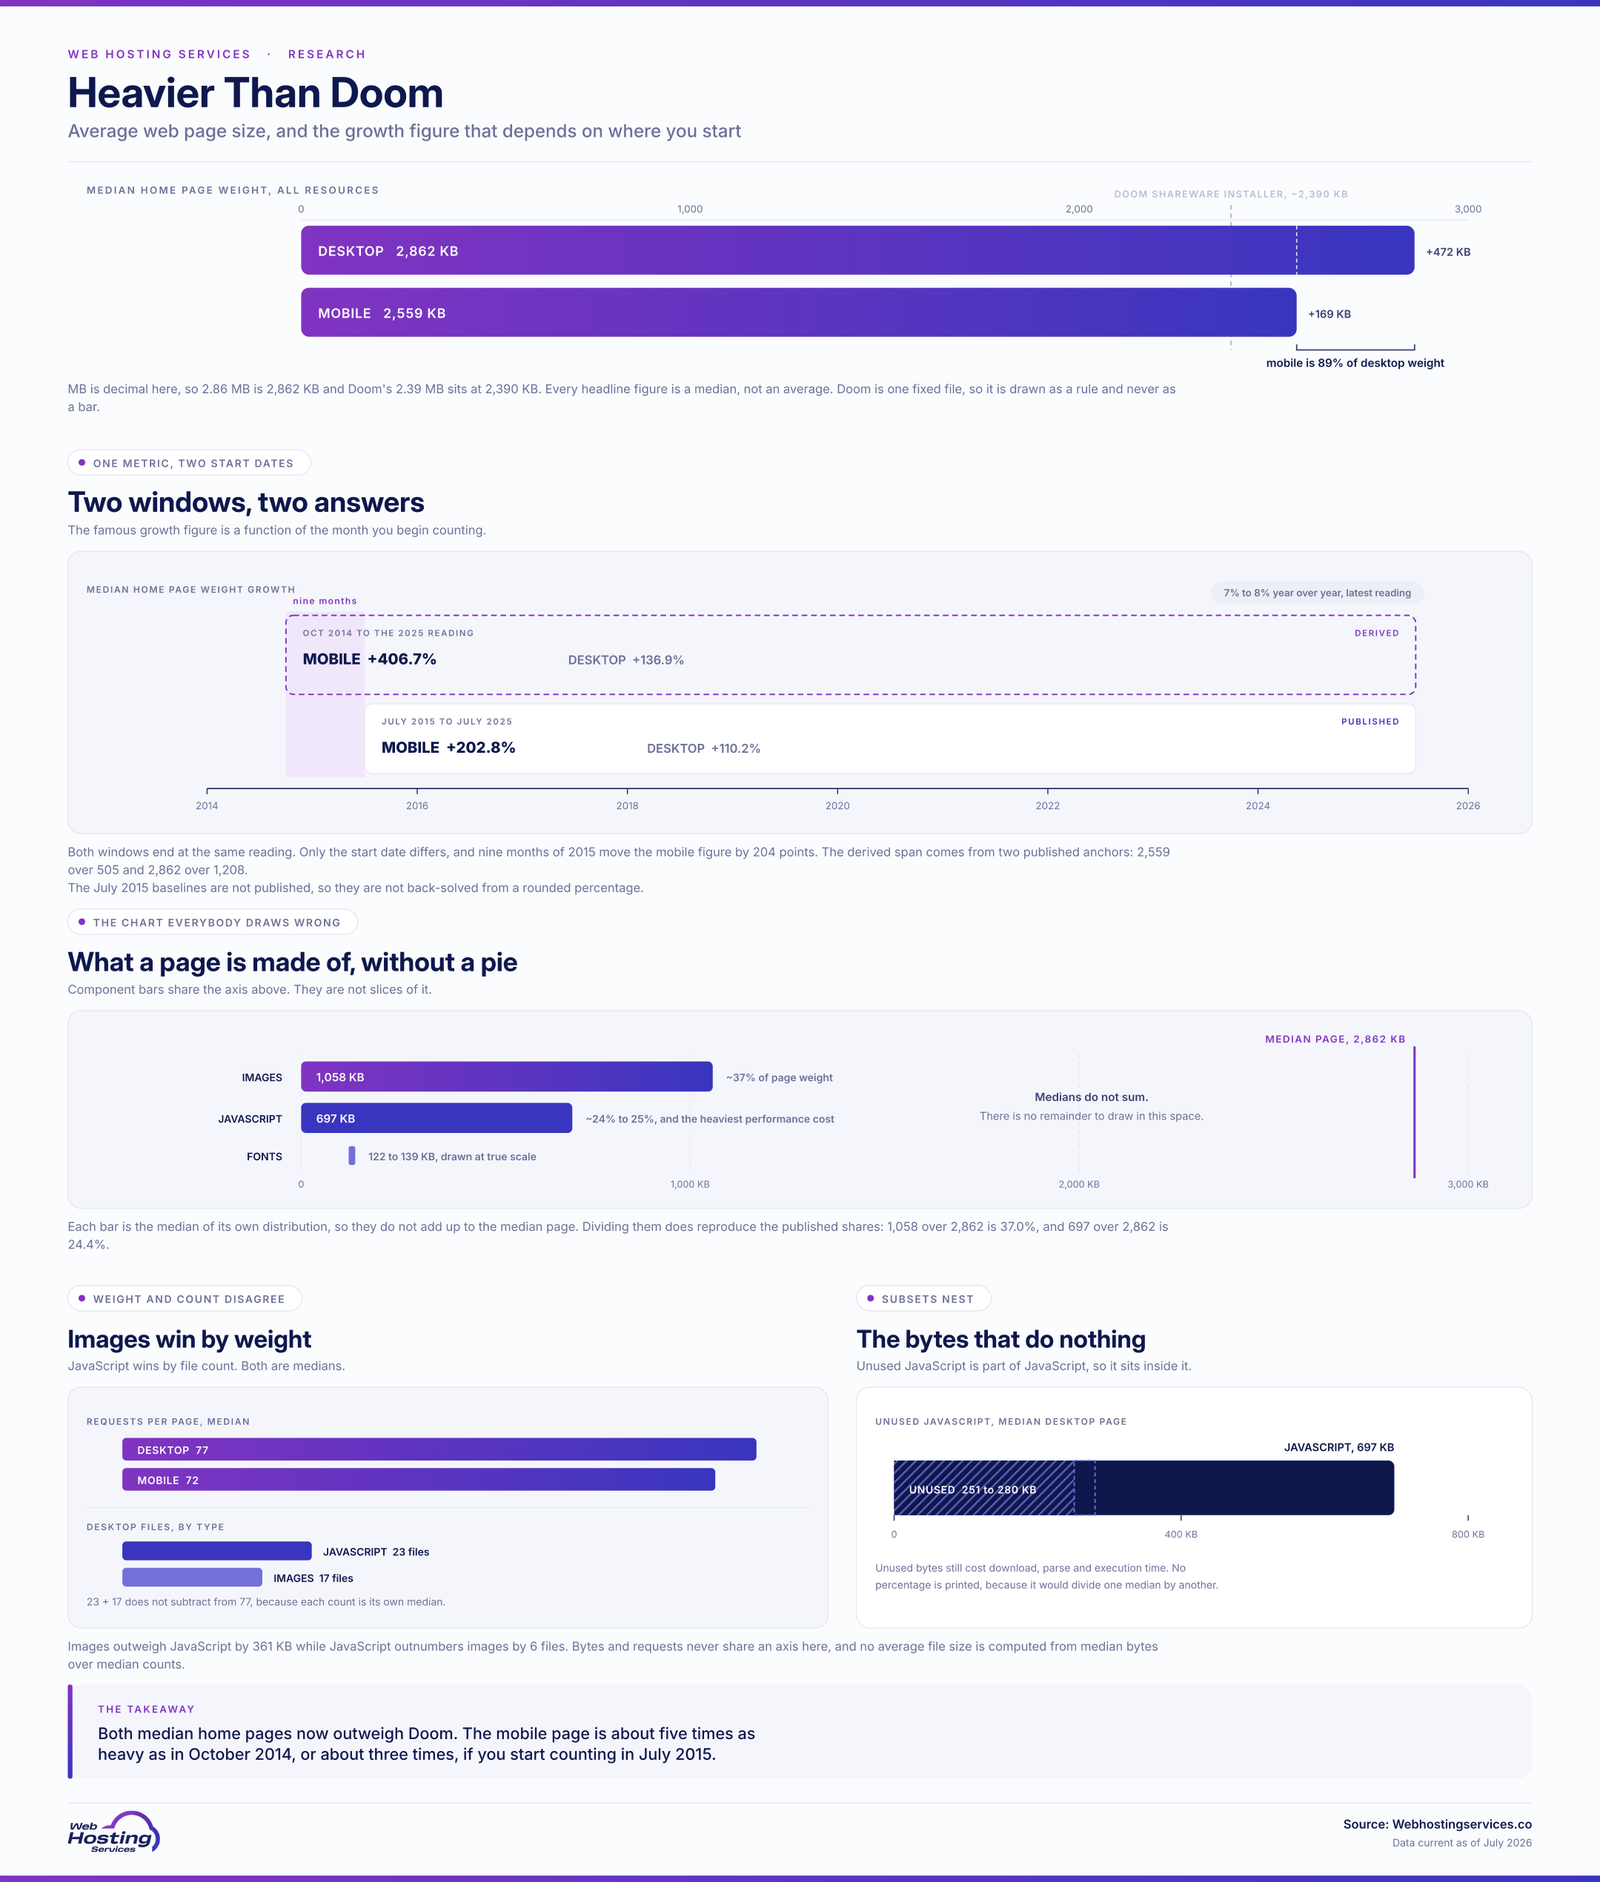
Research highlights: The median home page weighs about 2.86 MB on desktop and 2.56 MB on mobile, both now heavier than the compressed installer for the shareware version of Doom. A typical page makes around 72 to 77 requests. Images account for roughly 37% of median home page weight, with JavaScript second by size but heaviest in performance cost. Mobile home page weight grew over 200% in the decade from 2015 to 2025, and the climb continues.
Related research: Website speed statistics | Mobile vs desktop traffic | CDN market share | Sustainable web hosting | Website accessibility statistics
What is the average home page size today?
Note: these are median (typical) figures, which represent the web better than averages skewed by a few huge pages.
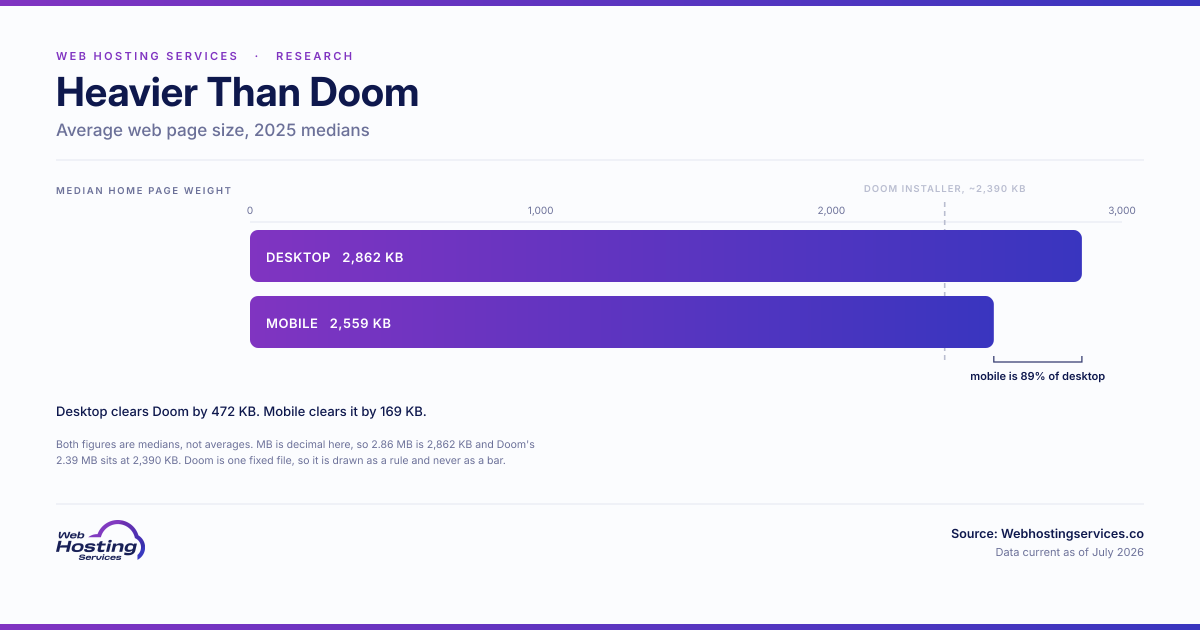
- The median desktop home page weighs about 2.86 MB (2,862 KB).
- The median mobile home page is slightly lighter at about 2.56 MB (2,559 KB).
- These figures include all resources: HTML, CSS, JavaScript, images, fonts and media.
- Both the median desktop and mobile home page now weigh more than the compressed installer for the shareware version of Doom, commonly cited at about 2.39 MB.
- Page weight growth has kept accelerating rather than leveling off.
|
Device |
Median home page weight |
|
Desktop |
~2.86 MB |
|
Mobile |
~2.56 MB |
The Doom comparison is more than a fun fact. It captures how much heavier the modern web has become, with a median home page now shipping more data than a compressed installer for a classic 1990s game, which directly shapes load times and data costs for users.
How many requests does the average web page make?
- The median desktop page makes about 77 separate requests to load.
- The median mobile page makes roughly 72 requests.
- JavaScript outpaces images in number of requests on desktop, about 23 files versus 17.
- Each request adds latency, especially on slower connections.
- Fewer, well-bundled requests generally mean faster page loads.
|
Device |
Requests per page |
|
Desktop |
~77 |
|
Mobile |
~72 |
The shift toward JavaScript is the real story in the request count. Pages now pull more script files than images, and since each one must be fetched, parsed and executed, that growth taxes performance far more than the raw request number suggests.
How has web page weight grown over time?
- In October 2014, the median desktop home page was about 1,208 KB and mobile about 505 KB.
- From July 2015 to July 2025, HTTP Archive reports mobile home page weight grew about 202.8%, while desktop grew about 110.2%.
- Today they sit near 2.86 MB desktop and 2.56 MB mobile.
- Year over year, the median page grew about 7% to 8% in the most recent reading.
- Growth has kept accelerating rather than leveling off in recent editions.
|
Period |
Desktop |
Mobile |
|
Oct 2014 |
1,208 KB |
505 KB |
|
2025 |
~2,862 KB |
~2,559 KB |
The long-term trend shows no sign of stopping. Faster networks and devices have let developers add ever more media and code, so pages keep expanding to fill the available bandwidth rather than getting leaner over time.
How does average home page size compare on mobile versus desktop?
- Desktop home pages are slightly heavier at 2.86 MB versus mobile home pages at 2.56 MB.
- Desktop loads more image bytes, driving most of the difference.
- Mobile now sits at about 89% of desktop weight, a narrowing gap.
- Mobile weight matters most, since phones often run on slower networks.
- Both device types have grown heavier every year rather than converging toward a lighter baseline.
|
Device |
Median home page weight |
|
Desktop |
~2.86 MB |
|
Mobile |
~2.56 MB |
The shrinking gap is a problem, not progress. Mobile home pages are nearly as heavy as desktop home pages, yet phones often face weaker networks and tighter data constraints, so the same payload can hurt mobile users more than desktop visitors. See our mobile vs desktop research.
What share of page weight comes from images and JavaScript?
- Images are the largest single component, around 37% of total page weight.
- JavaScript is second by size, at roughly 24% to 25%, but carries the heaviest performance cost.
- A median desktop page loads about 1,058 KB of images and 697 KB of JavaScript.
- Roughly 251 to 280 KB of that JavaScript goes completely unused.
- Fonts add around 122 to 139 KB, with CSS and HTML far smaller.
|
Resource |
Share of weight |
|
Images |
~37% |
|
JavaScript |
~24-25% |
|
Fonts, CSS, HTML, video and other resources |
The remainder |
The biggest wins hide in these two resources. Images dominate raw transfer weight, so modern formats like WebP and AVIF can cut many bytes, while trimming unused JavaScript reduces download, parse and execution work for the browser. See our website speed research.
Sources & additional resources
- HTTP Archive. “Page Weight, Web Almanac 2025.” HTTP Archive.
- HTTP Archive. “Page Weight, Web Almanac 2024.” HTTP Archive.
- HTTP Archive. “Page Weight Report.” HTTP Archive.
- WIRED. “The Average Webpage Is Now the Size of the Original Doom.” WIRED.
- Google. “Web Vitals and Performance.” web.dev.
Web Hosting Services helps you build leaner, faster pages, with independent performance and hosting research, current hosting deals and managed WordPress hosting with caching, a built-in CDN and tuned servers built to keep pages quick.
Disclaimer: This article is for informational purposes only and is not legal, technical, performance-engineering, SEO, financial, business, hosting, sustainability or purchasing advice. Average web page size statistics, HTTP Archive page-weight benchmarks, request-count data, mobile and desktop performance figures, image and JavaScript weight estimates, unused-code measurements, historical page-growth trends, Web Almanac findings and third-party methodologies can change at any time and may vary by source, reporting period, website sample, page type, browser, device, network condition, resource classification, compression method, caching behavior and measurement definition. Always confirm current figures, performance requirements, optimization priorities, hosting needs, sustainability assumptions and methodology directly with the cited source, performance tool, hosting provider, technical documentation, web developer or qualified professional before making website performance, hosting, optimization, business or purchasing decisions based on average web page size statistics.