











Green and sustainable web hosting statistics
 By: Mendy Perlman
|
Updated: July 15, 2026
|
✓Fact Checked
|
By: Mendy Perlman
|
Updated: July 15, 2026
|
✓Fact Checked
|
Cite this Research
Cite this research
Perlman, M. (2026, July 15). Green and sustainable web hosting statistics. Web Hosting Services. https://webhostingservices.co/research/sustainable-web-hosting-statistics
Perlman, Mendy. “Green and Sustainable Web Hosting Statistics.” Web Hosting Services, 15 July 2026, https://webhostingservices.co/research/sustainable-web-hosting-statistics.
Perlman, Mendy. “Green and Sustainable Web Hosting Statistics.” Web Hosting Services. Last modified July 15, 2026. https://webhostingservices.co/research/sustainable-web-hosting-statistics.
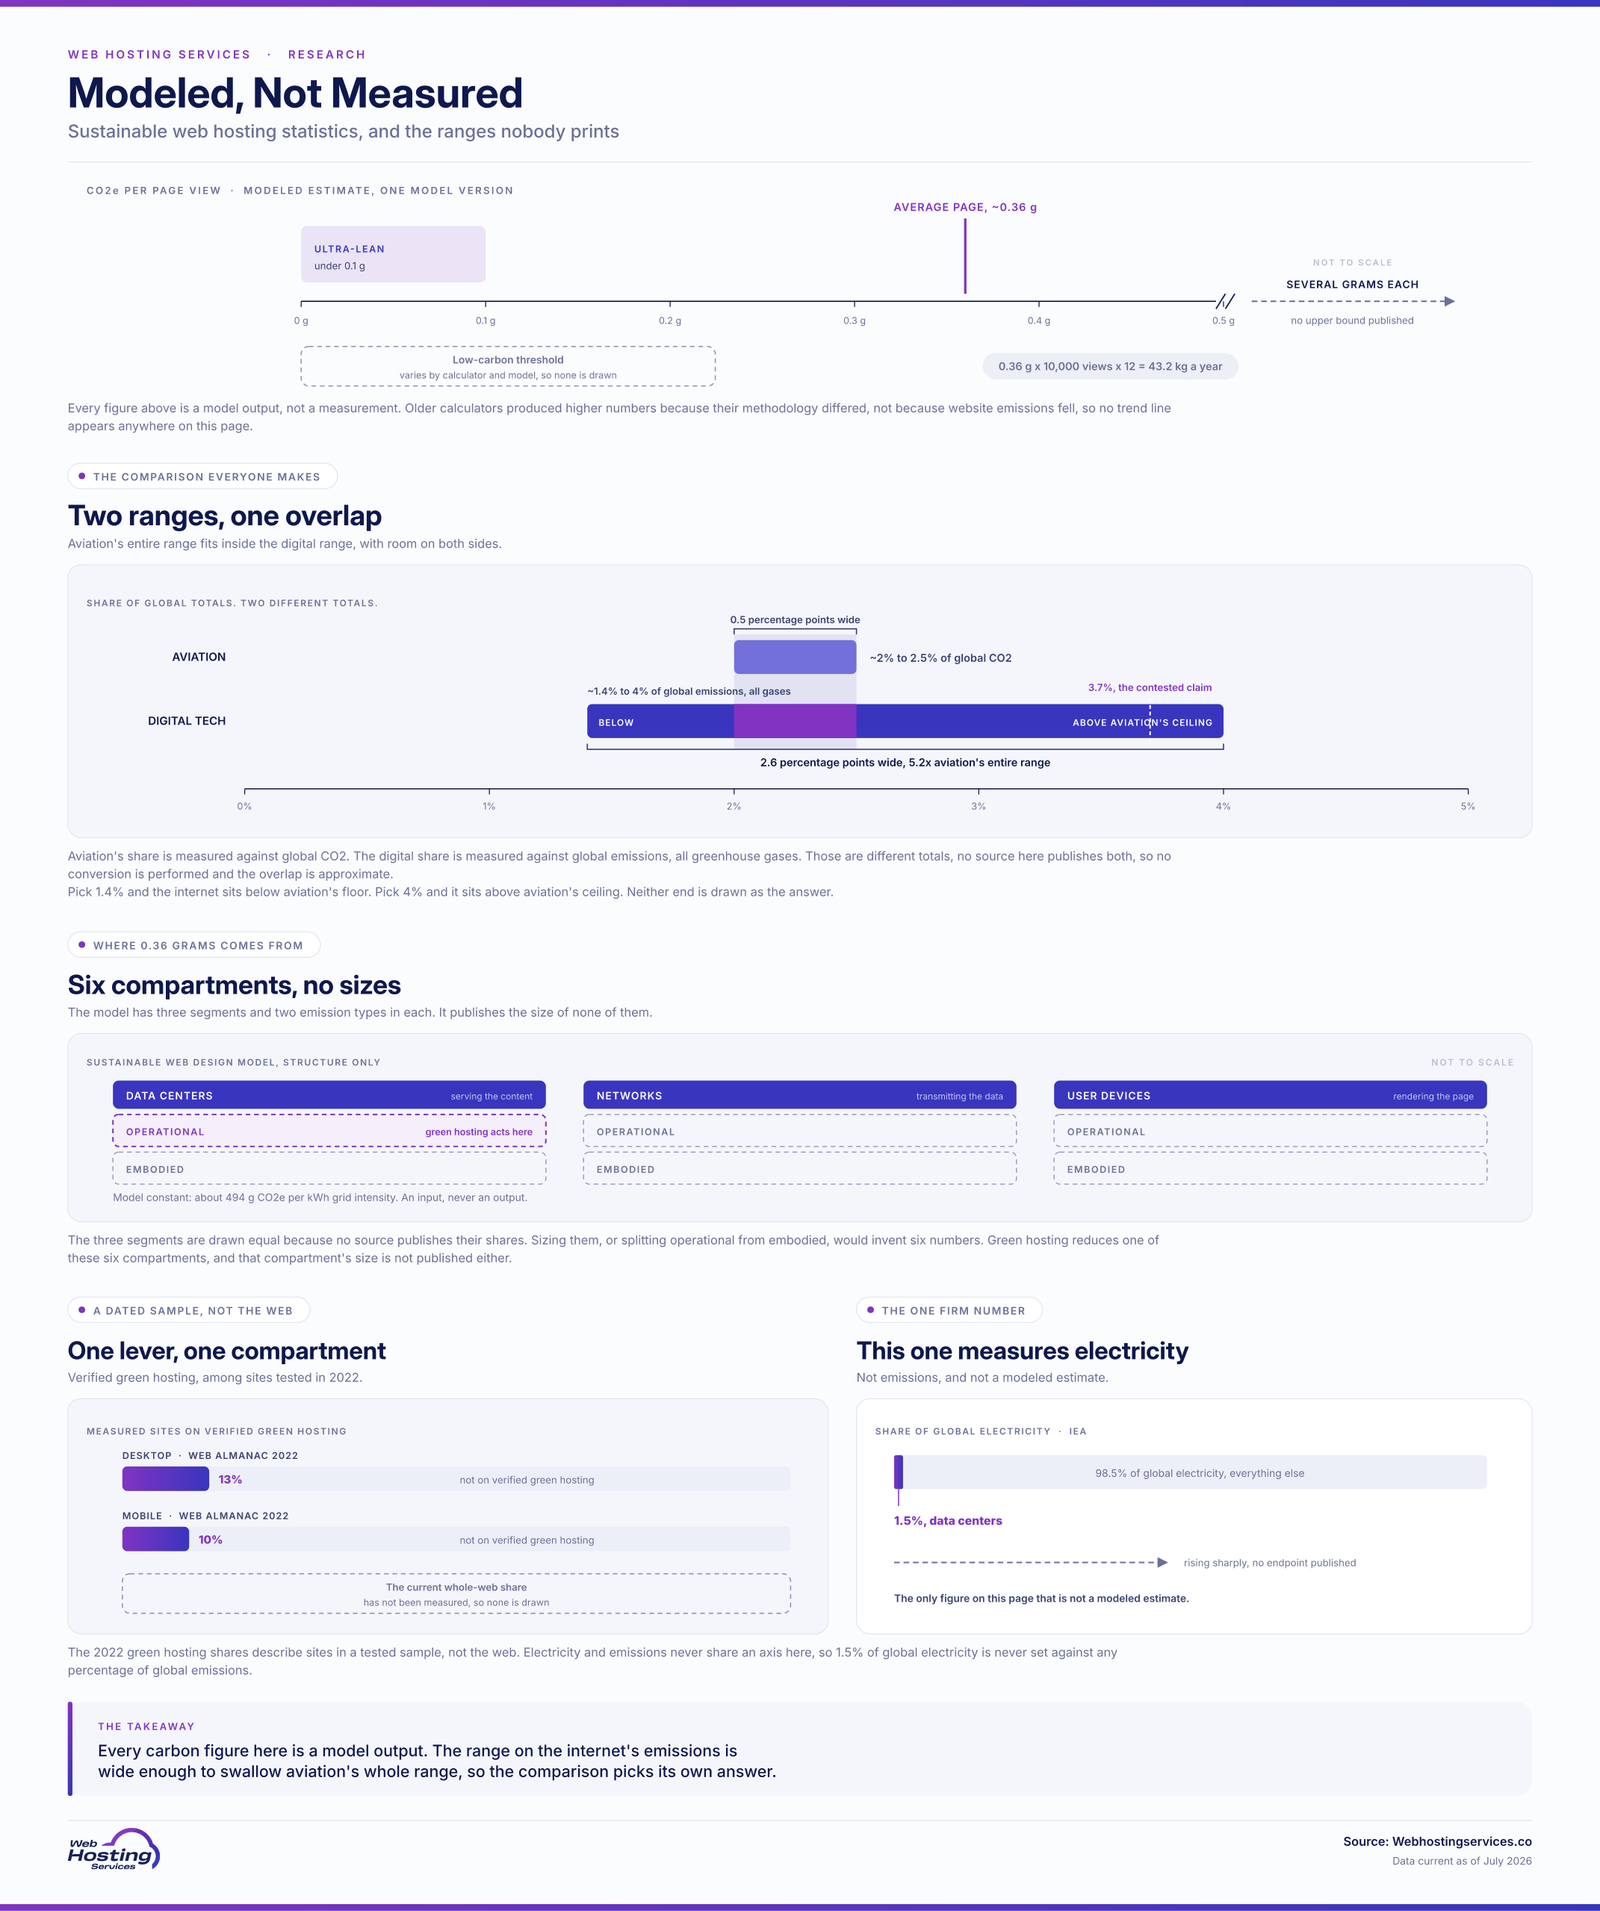
Research highlights: The average web page emits roughly 0.36 grams of CO2e per view under the current Website Carbon / Sustainable Web Design model, though estimates vary widely by methodology. Data centers use about 1.5% of global electricity, per the IEA. Older Web Almanac data found most measured websites were not on verified green hosting. The popular claim that the internet out-pollutes aviation is widely cited but genuinely contested.
How much carbon does the average website produce?
Note: all website carbon figures are modeled estimates, not direct measurements, and depend heavily on the methodology used.
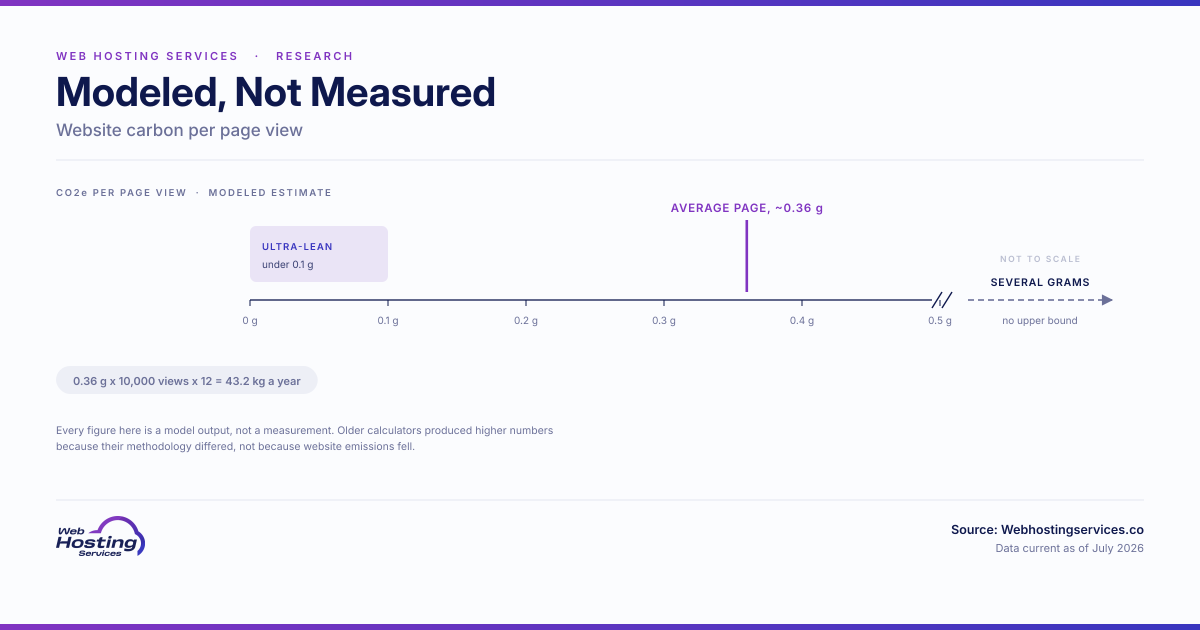
- The average web page emits about 0.36 grams of CO2e per view under the current Website Carbon / Sustainable Web Design Model.
- A site with 10,000 monthly views produces roughly 43 kg of CO2e a year.
- Older calculator methodologies produced considerably higher estimates, so website-carbon figures should always be tied to the specific model version used.
- Those gaps reflect differences in methodology between tools, not necessarily a real drop in emissions over time.
- Lower-carbon pages sit below the current average, but exact thresholds vary by calculator, model and benchmark.
|
Metric |
Figure |
|
Average CO2e per page view |
~0.36 g |
|
Low-carbon threshold |
Varies by calculator and model |
|
10,000 views/month |
~43 kg CO2e/year |
The wide range between methodologies is the key caveat. Precise measurement of a website’s carbon is nearly impossible, so every calculator is really an estimator, and the figures should be treated as directional rather than exact.
How much CO2e does a single page view generate?
Note: per-view figures are model-based and vary enormously by page weight and hosting.
- The average single page view generates about 0.36 grams of CO2e.
- Ultra-lean, optimized sites can drop below 0.1 grams per view.
- Heavy, bloated pages can emit several grams each.
- Page weight and the hosting energy source are the main drivers.
- The same content can vary widely depending on how it is built.
|
Site type |
CO2e per view |
|
Ultra-lean site |
Under 0.1 g |
|
Average site |
~0.36 g |
|
Heavy site |
Several grams |
The spread is the actionable insight. Since a lean page can emit a fraction of a heavy one’s carbon, the same optimizations that speed up a site, smaller images and less JavaScript, also cut its footprint. See our average web page size research.
What share of global emissions comes from the internet and data centers?
Note: the broad “internet emissions” figure is contested; the firmer number is data-center electricity use from the IEA.
- Data centers use about 1.5% of global electricity, a relatively firm figure from the IEA.
- Digital technology overall is often cited at roughly 3.7% of global emissions.
- That broader figure is contested, tracing to 2019 modeling criticized as high.
- Credible estimates range widely, from about 1.4% to 4%.
- IEA expects data-center electricity demand to rise sharply this decade, with AI and other digital services driving much of the increase.
|
Metric |
Figure |
|
Data centers (% of electricity) |
~1.5% |
|
Digital tech (% of emissions) |
~1.4% to 4% (disputed) |
Honesty matters more than a dramatic headline here. The data-center electricity figure is well-supported, but the sweeping “internet emissions” percentages rest on shaky modeling, so they deserve skepticism even as the underlying concern is real. See our data center energy research.
How much energy does a website use per visit?
Note: energy-per-visit values are modeled across the delivery chain and vary by site and visitor.
- The Sustainable Web Design Model estimates emissions across three system segments: data centers, networks and user devices, with both operational and embodied emissions included in each.
- The current Sustainable Web Design Model uses a global average grid intensity of about 494 grams of CO2e per kWh.
- Page weight is a major driver of energy per visit.
- Each visit uses a small but real amount of electricity.
- Lighter pages reduce data transfer across the chain, while green hosting lowers the modeled emissions from the data-center operational segment.
|
Energy stage |
Role |
|
Data centers |
Serving the content |
|
Networks |
Transmitting the data |
|
User devices |
Rendering the page |
The chain view explains why optimization helps everywhere. A lighter page does not just ease the data center, it cuts energy across networks and devices too, multiplying the benefit of every kilobyte saved. See our website speed research.
How many hosting providers run on renewable energy?
Note: green-hosting figures come from the Green Web Foundation directory and tested-site samples, not the whole web.
- Older HTTP Archive data found that verified green hosting was still a minority among measured websites.
- The Green Web Foundation maintains a directory of verified green hosting providers.
- In the Sustainable Web Design Model, verified renewable or zero-carbon hosting lowers the modeled data-center operational emissions through the green hosting factor.
- Most measured websites in older Web Almanac data were not on verified green hosting.
- Because green-hosting shares depend on the tested sample and methodology, current whole-web percentages should be treated cautiously.
|
Metric |
Figure |
|
Measured sites on verified green hosting, Web Almanac 2022 |
~13% desktop; ~10% mobile |
|
Green hosting effect in SWD model |
Reduces modeled data-center operational emissions |
Hosting choice is an important lever, but it is only one part of the chain. Verified green hosting can lower the modeled data-center operational emissions, while lighter pages reduce data transfer across data centers, networks and user devices. See our web hosting cost research.
How does the internet’s carbon footprint compare to aviation?
Note: this comparison is widely repeated but genuinely contested, so it should be read with caution.
- The popular claim is that the internet rivals or exceeds aviation in emissions.
- It rests on a figure of about 3.7% of global emissions for digital tech.
- Aviation accounts for roughly 2% to 2.5% of global CO2.
- The internet figure is disputed, based on 2019 modeling many call too high.
- Both are meaningful, fast-growing contributors, but the exact ranking is uncertain.
|
Sector |
Share of global emissions |
|
Aviation |
~2% to 2.5% |
|
Digital tech (disputed) |
~1.4% to 3.7% |
The honest conclusion is to resist the neat headline. Whether the internet truly out-pollutes aviation depends on contested assumptions, but the practical takeaway holds regardless: digital emissions are real, rising and worth reducing through leaner sites and greener hosting. See our data center energy research.
Sources & additional resources
- Website Carbon. “Website Carbon Calculator.” Wholegrain Digital.
- Sustainable Web Design. “Sustainable Web Design Model.” Sustainable Web Design.
- Green Web Foundation. “Understanding the Latest Sustainable Web Design Model Update.” Green Web Foundation.
- HTTP Archive. “Sustainability, Web Almanac 2022.” HTTP Archive.
- IEA. “Energy and AI.” International Energy Agency.
- Malmodin, Jens, et al. “ICT Sector Electricity Consumption and Greenhouse Gas Emissions.” Telecommunications Policy.
- The Shift Project. “Lean ICT: Towards Digital Sobriety.” The Shift Project.
- The Shift Project. “Climate Crisis: The Unsustainable Use of Online Video.” The Shift Project.
- Our World in Data. “What Share of Global CO2 Emissions Come from Aviation?.” Our World in Data.
- Green Web Foundation. “Green Hosting Directory.” Green Web Foundation.
- W3C. “Sustainable Web Design Guidelines.” W3C Sustainable Web Community Group.
Web Hosting Services helps you build a greener, faster site, with independent sustainability and hosting research, current hosting deals and managed WordPress hosting with speed optimization, caching, managed updates, backups and security hardening.
Disclaimer: This article is for informational purposes only and is not legal, technical, environmental, sustainability, ESG, carbon-accounting, financial, business, hosting or purchasing advice. Sustainable web hosting statistics, website carbon estimates, CO2e-per-view calculations, data-center electricity figures, internet emissions comparisons, aviation comparisons, green-hosting verification data, renewable-energy claims, Sustainable Web Design model assumptions, Website Carbon calculator outputs, Web Almanac findings and third-party methodologies can change at any time and may vary by source, reporting period, model version, website sample, page weight, traffic volume, hosting provider, grid intensity, region, energy sourcing, caching behavior and measurement definition. Always confirm current figures, sustainability claims, carbon methodology, hosting requirements, renewable-energy status, compliance obligations and assumptions directly with the cited source, hosting provider, Green Web Foundation listing, carbon-accounting professional, sustainability advisor, technical documentation or qualified expert before making green hosting, sustainability, optimization, business or purchasing decisions based on sustainable web hosting statistics.