











Website Performance and User Experience Statistics
Research updated for 2026
Performance data is unusually well measured, because Chrome reports real user metrics for millions of origins and the HTTP Archive has tracked page composition for over a decade. These four pages cover how many sites actually pass the performance thresholds, how heavy pages have become, where traffic is coming from, and how accessible the web really is.
Website speed and performance statistics
Roughly half of sites pass Core Web Vitals, and one metric accounts for most of the failures. This covers current pass rates and the conversion research behind treating speed as a business metric.
Mobile versus desktop web traffic statistics
The mobile share of web traffic is commonly overstated, and it varies enormously by region. This covers the current global split and the markets sitting at either extreme.
Website accessibility statistics
Almost every homepage tested has detectable accessibility failures, and the trend recently reversed after years of slow improvement. This covers error rates, the handful of issues causing most of them, and the legal exposure.
Average web page size and performance benchmarks
Median page weight has grown steadily for a decade with no sign of reversing. This covers desktop and mobile weights, request counts, and which resource types account for the bulk of it.
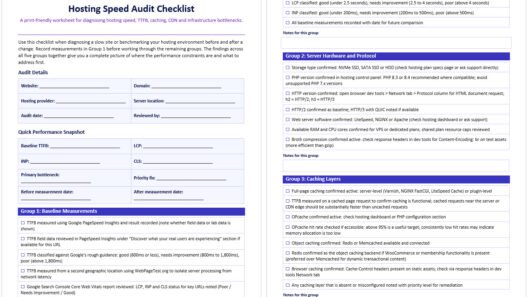
These pages establish what typical looks like across the web. To measure your own site against it, the hosting speed audit checklist works through what to check. Hosting is only one input into site speed. See how web hosting impacts website speed for where it does and does not make a difference. Return to all research.