









Website security statistics - how many sites get hacked?
 By: Mendy Perlman
|
Updated: July 15, 2026
|
✓Fact Checked
|
By: Mendy Perlman
|
Updated: July 15, 2026
|
✓Fact Checked
|
Cite this Research
Cite this research
Perlman, M. (2026, July 15). Website security statistics: how many sites get hacked? Web Hosting Services. https://webhostingservices.co/research/website-hacking-statistics
Perlman, Mendy. “Website Security Statistics: How Many Sites Get Hacked?” Web Hosting Services, 15 July 2026, https://webhostingservices.co/research/website-hacking-statistics.
Perlman, Mendy. “Website Security Statistics: How Many Sites Get Hacked?” Web Hosting Services. Last modified July 15, 2026. https://webhostingservices.co/research/website-hacking-statistics.
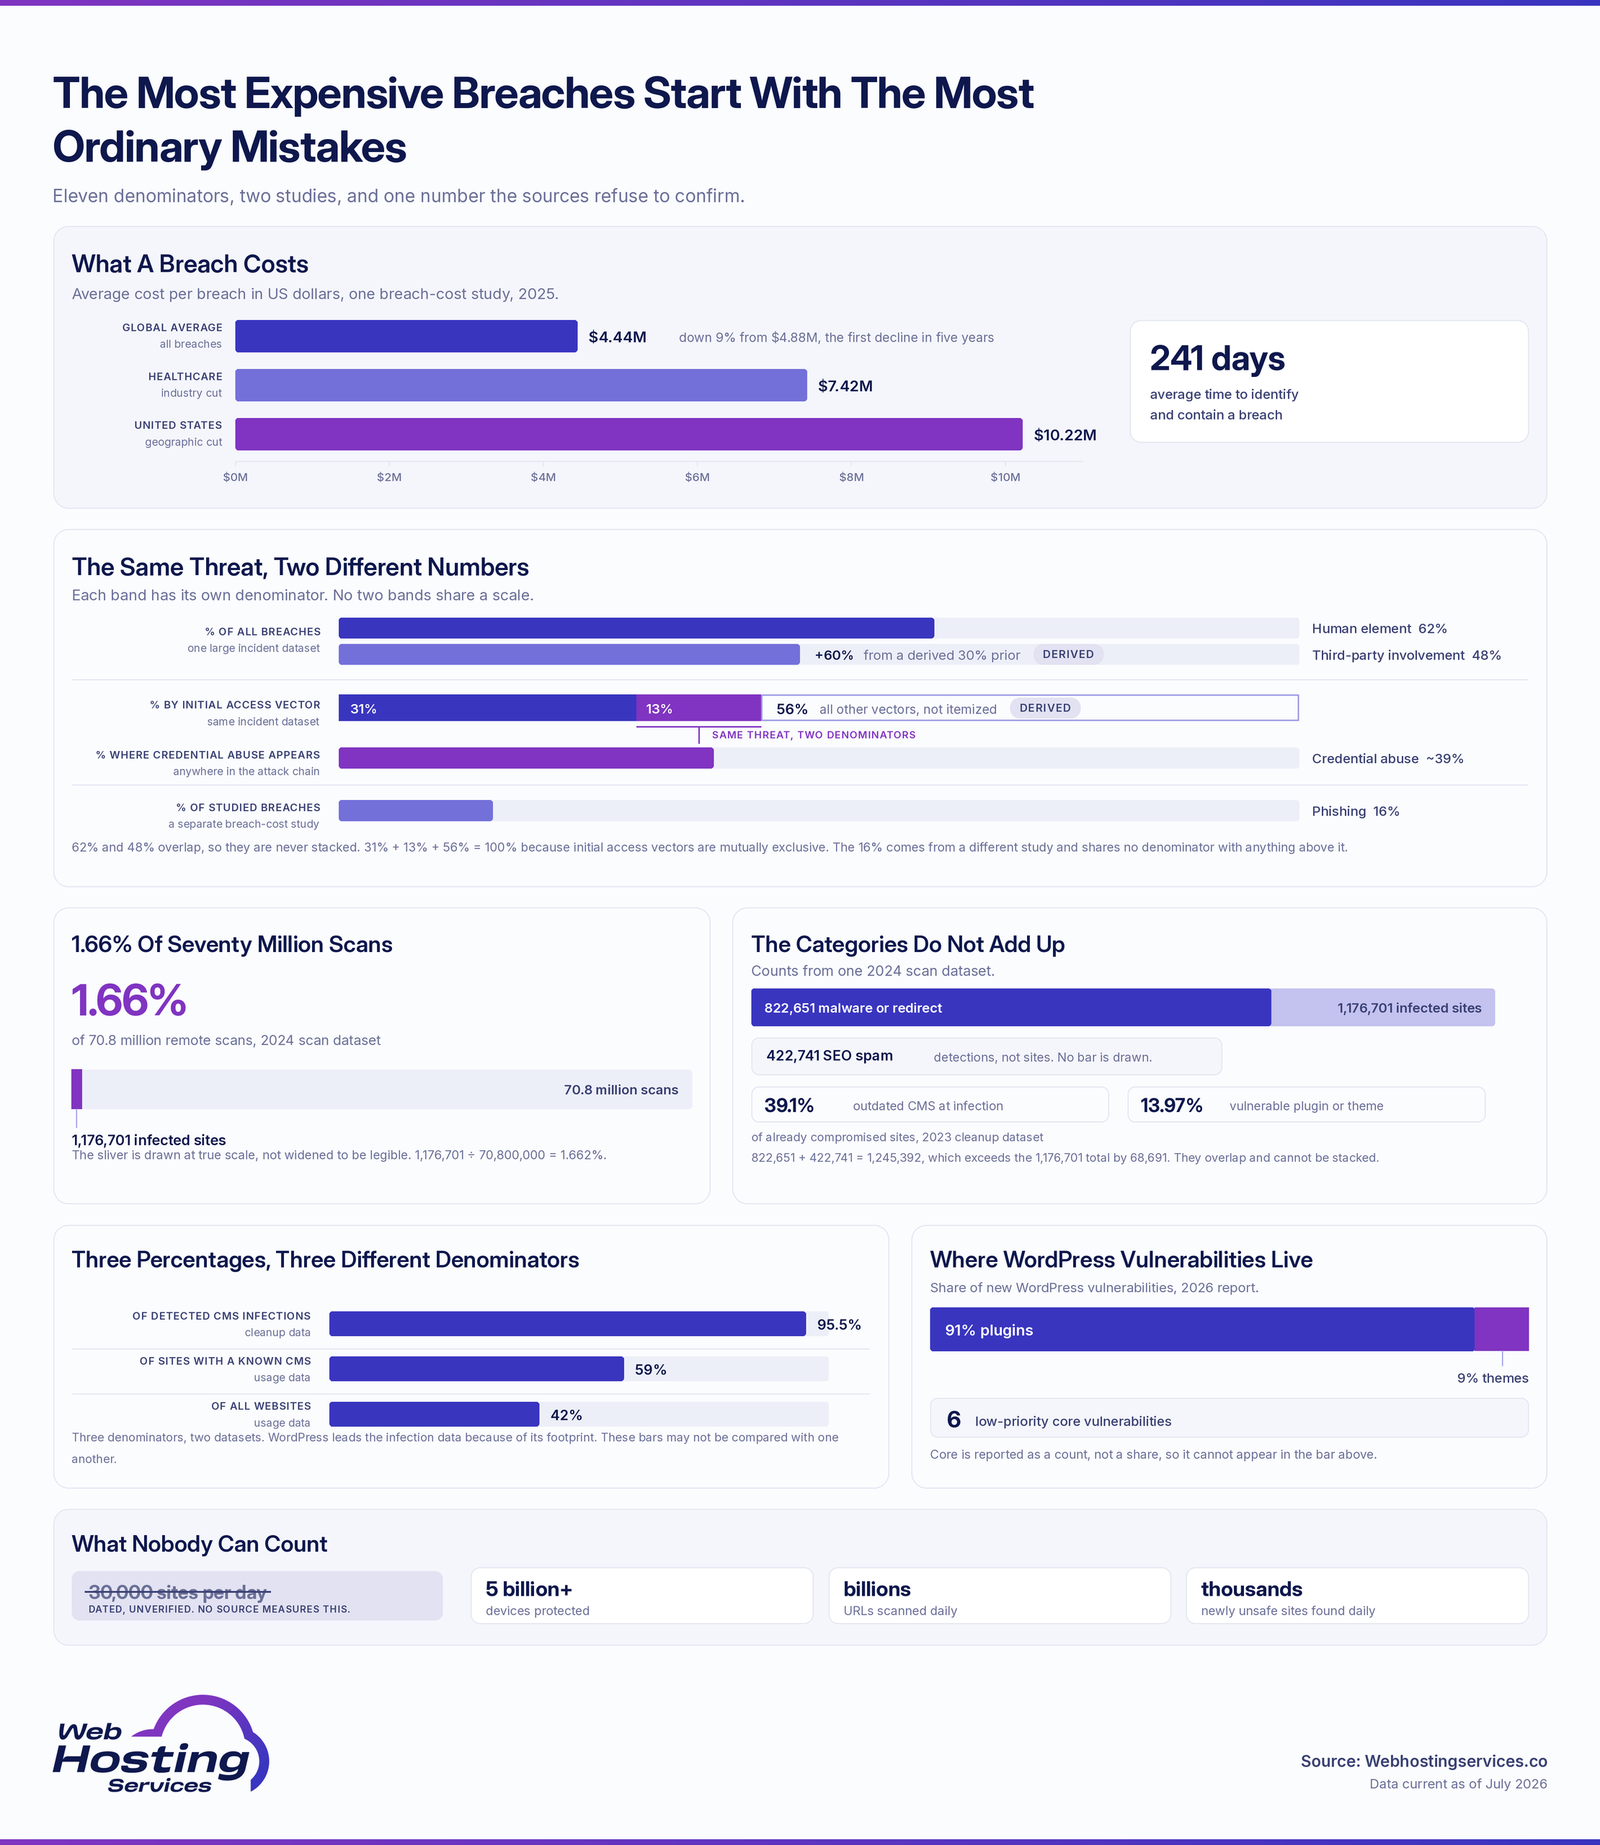
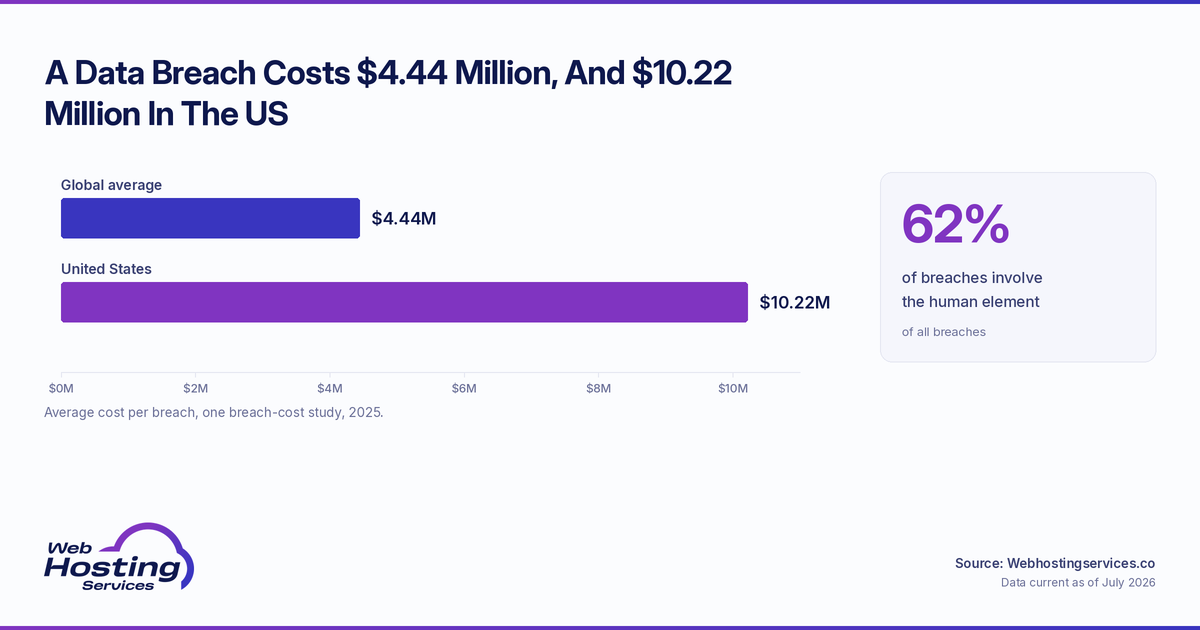
Research highlights: A data breach now costs $4.44 million globally on average and a record $10.22 million in the US, per IBM. Most breaches are not exotic: the human element factors into 62% of them, according to the 2026 Verizon DBIR. Google Safe Browsing protects over 5 billion devices and flags thousands of newly unsafe sites daily, many of them legitimate sites that were compromised.
Related research: DDoS attack statistics | HTTPS and SSL adoption | Cost of website downtime | WordPress market share | Bot traffic statistics
How many websites are hacked each day?
Note: precise daily hack counts cannot be verified; the widely-cited “30,000 a day” figure is a dated estimate, not a confirmed measurement.
- No source reliably counts every site compromised each day, so exact figures are guesses.
- The often-repeated 30,000 sites per day stat traces to old estimates and is unverified.
- Google says Safe Browsing discovers thousands of newly unsafe sites every day.
- Many of those are legitimate sites that were compromised, not malicious from the start.
- Many compromises involve known security gaps, outdated software or stolen credentials rather than brand-new attack techniques.
|
Metric |
Status |
|
“30,000 sites/day” figure |
Dated, unverified |
|
Newly unsafe sites found daily (Google) |
Thousands |
The honest answer is that the daily count is not publicly measurable from a single authoritative source. Rather than chase a viral round number, the useful takeaway is that Google keeps discovering thousands of newly unsafe sites each day, and many are legitimate websites compromised through known or preventable weaknesses.
What percentage of websites contain malware or vulnerabilities?
Note: these are scan-based estimates from Sucuri and reflect its SiteCheck and remediation datasets, not the entire web at scale.
- Sucuri’s 2024 SiteCheck dataset found an overall website infection rate of 1.66% across 70.8 million remote scans.
- It detected 1,176,701 infected websites, with 822,651 involving active malware infections or malicious redirects.
- SEO spam was another major category, with 422,741 detections, showing that many compromises target traffic and rankings.
- In Sucuri’s 2023 remediation dataset, 39.1% of CMS applications were outdated at the point of infection.
- Sucuri also found 13.97% of compromised websites had at least one vulnerable plugin or theme at remediation.
- These figures are methodology-dependent, since remote scan data and cleanup data measure different populations.
|
Metric |
Figure |
|
Sucuri SiteCheck infection rate (2024 scans) |
1.66% |
|
Infected websites detected by Sucuri SiteCheck (2024) |
1,176,701 |
|
Active malware or redirect detections (2024) |
822,651 |
|
SEO spam detections (2024) |
422,741 |
|
Outdated CMS at point of infection (Sucuri 2023 remediation data) |
39.1% |
|
Compromised sites with vulnerable plugin/theme (Sucuri 2023 remediation data) |
13.97% |
The key distinction is infection versus exposure. Sucuri’s remote scanner found a low single-digit infection rate in its 2024 dataset, while its cleanup data shows that outdated CMS software and vulnerable third-party components remain common on already compromised websites.
What are the most common causes of website breaches?
- The human element was present in 62% of breaches in the 2026 Verizon DBIR.
- Exploiting software vulnerabilities became the most common initial access vector, at 31% of breaches in Verizon’s 2026 dataset.
- Credential abuse fell to 13% as an initial access vector, while the full DBIR reports it appearing in about 39% of breaches across the broader attack chain.
- Phishing was IBM’s most frequent initial attack vector in its 2025 cost report, at 16% of studied breaches.
- Third-party involvement increased by 60% from Verizon’s previous dataset, reaching 48% of total breaches.
|
Metric |
Share |
Source/method |
|
Human element present |
62% |
Verizon DBIR, all breaches |
|
Vulnerability exploitation |
31% |
Verizon DBIR, initial access vector |
|
Credential abuse |
13% initial / ~39% broader chain |
Verizon DBIR, different denominators |
|
Phishing |
16% |
IBM, initial attack vector |
|
Third-party involvement |
48% |
Verizon DBIR, total breaches |
The pattern is consistent: the highest-value controls are still basic but difficult operational work, including timely patching, phishing-resistant authentication, credential protection, supplier oversight and employee training.
How much does a data breach cost on average?
- The global average breach cost is $4.44 million in 2025, per IBM.
- That is down 9% from $4.88 million, the first decline in five years.
- In the US, the average hit a record $10.22 million.
- Healthcare is the costliest industry at $7.42 million, according to IBM’s 2025 report.
- The average breach takes 241 days to identify and contain.
|
Metric |
Figure |
|
Global average |
$4.44 million |
|
US average |
$10.22 million |
|
Breach lifecycle |
241 days |
The global dip is real but misleading on its own, driven by faster detection and containment at mature organizations. For US businesses, costs are rising the other way, pushed up by higher regulatory fines and detection and escalation costs, making the country the most expensive place to suffer a breach.
Which CMS platforms see the most website infections?
Note: these figures come from security-firm cleanup and scan data and reflect market share as much as risk.
- WordPress made up 95.5% of detected CMS infections in Sucuri’s dataset.
- That reflects WordPress’s large footprint; W3Techs reports it on about 42% of all websites and roughly 59% of sites with a known CMS.
- Patchstack’s 2026 report found 91% of new WordPress vulnerabilities in plugins and 9% in themes, with only 6 low-priority core vulnerabilities.
- Outdated extensions are a major website security risk because attackers can scan for and exploit known plugin, theme and third-party component weaknesses.
- Any platform’s risk rises sharply with neglected updates.
|
Factor |
Detail |
|
Most-seen CMS in Sucuri’s infection data |
WordPress (95.5%) |
|
WordPress usage share (W3Techs) |
~42% of all sites, ~59% of known-CMS sites |
|
New WordPress vulnerabilities by component (Patchstack 2026) |
91% plugins, 9% themes, 6 core |
WordPress tops Sucuri’s cleanup data because it has a very large web footprint, not because that data proves it is uniquely insecure. The real lesson is in the extension data: most newly reported WordPress vulnerabilities were in plugins or themes, while Patchstack found only a few low-priority core issues. See our WordPress market share research.
How many sites are flagged by Google Safe Browsing for malware?
- Google Safe Browsing protects over 5 billion devices every day.
- It scans billions of URLs daily to find unsafe sites.
- It discovers thousands of newly unsafe sites each day.
- Many flagged sites are legitimate ones that attackers compromised.
- Safe Browsing covers phishing, social engineering, malware and unwanted software as distinct threat categories.
|
Metric |
Figure |
|
Devices protected |
5 billion+ |
|
URLs scanned daily |
Billions |
|
New unsafe sites found daily |
Thousands |
Safe Browsing is the web’s quiet immune system. It not only warns visitors but also alerts site owners when their sites are compromised, which is often how a small business first learns it has been hacked. To secure your site, see our HTTPS and SSL research.
Sources & additional resources
- IBM. “Cost of a Data Breach Report.” IBM.
- Verizon. “Data Breach Investigations Report.” Verizon Business.
- Google. “Google Safe Browsing.” Google.
- Google. “Safe Browsing.” Google Help.
- Patchstack. “State of WordPress Security in 2026.” Patchstack.
- W3Techs. “Usage Statistics and Market Share of WordPress.” W3Techs.
- Sucuri. “SiteCheck Malware Trends Report 2024.” Sucuri.
- Sucuri. “2023 Hacked Website & Malware Threat Report.” Sucuri.
Web Hosting Services helps you keep your site secure, with independent security and hosting research, current hosting deals from providers with built-in security, and managed WordPress hosting with automatic updates, firewalls and malware scanning.
Disclaimer: This article is for informational purposes only and is not legal, technical, cybersecurity, financial, insurance, business, hosting or purchasing advice. Website hacking statistics, breach-cost estimates, malware infection rates, vulnerability data, CMS infection shares, Safe Browsing figures, phishing and credential-abuse trends, third-party breach involvement, remediation datasets, scan-based measurements and security-report methodologies can change at any time and may vary by source, reporting period, website sample, platform, industry, geography, attacker behavior, detection method and incident definition. Always confirm current figures, security risks, compliance obligations, hosting requirements, remediation steps, insurance coverage and methodology directly with the cited source, security provider, hosting provider, legal advisor, insurer, cybersecurity professional or qualified expert before making website security, hosting, business, insurance or purchasing decisions based on website hacking statistics.