



Web server market share
Cite this Research
Cite this research
Perlman, M. (2026, July 8). Web server market share. Web Hosting Services. https://webhostingservices.co/research/web-server-market-share
Perlman, Mendy. “Web Server Market Share.” Web Hosting Services, 8 July 2026, https://webhostingservices.co/research/web-server-market-share.
Perlman, Mendy. “Web Server Market Share.” Web Hosting Services. Last modified July 8, 2026. https://webhostingservices.co/research/web-server-market-share.
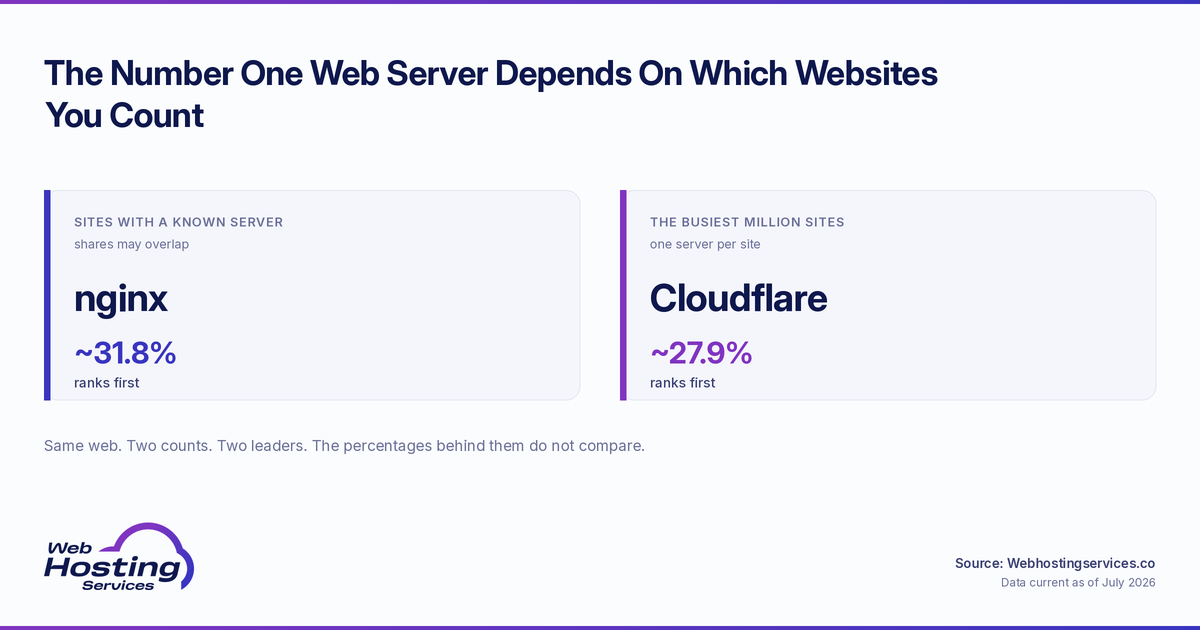
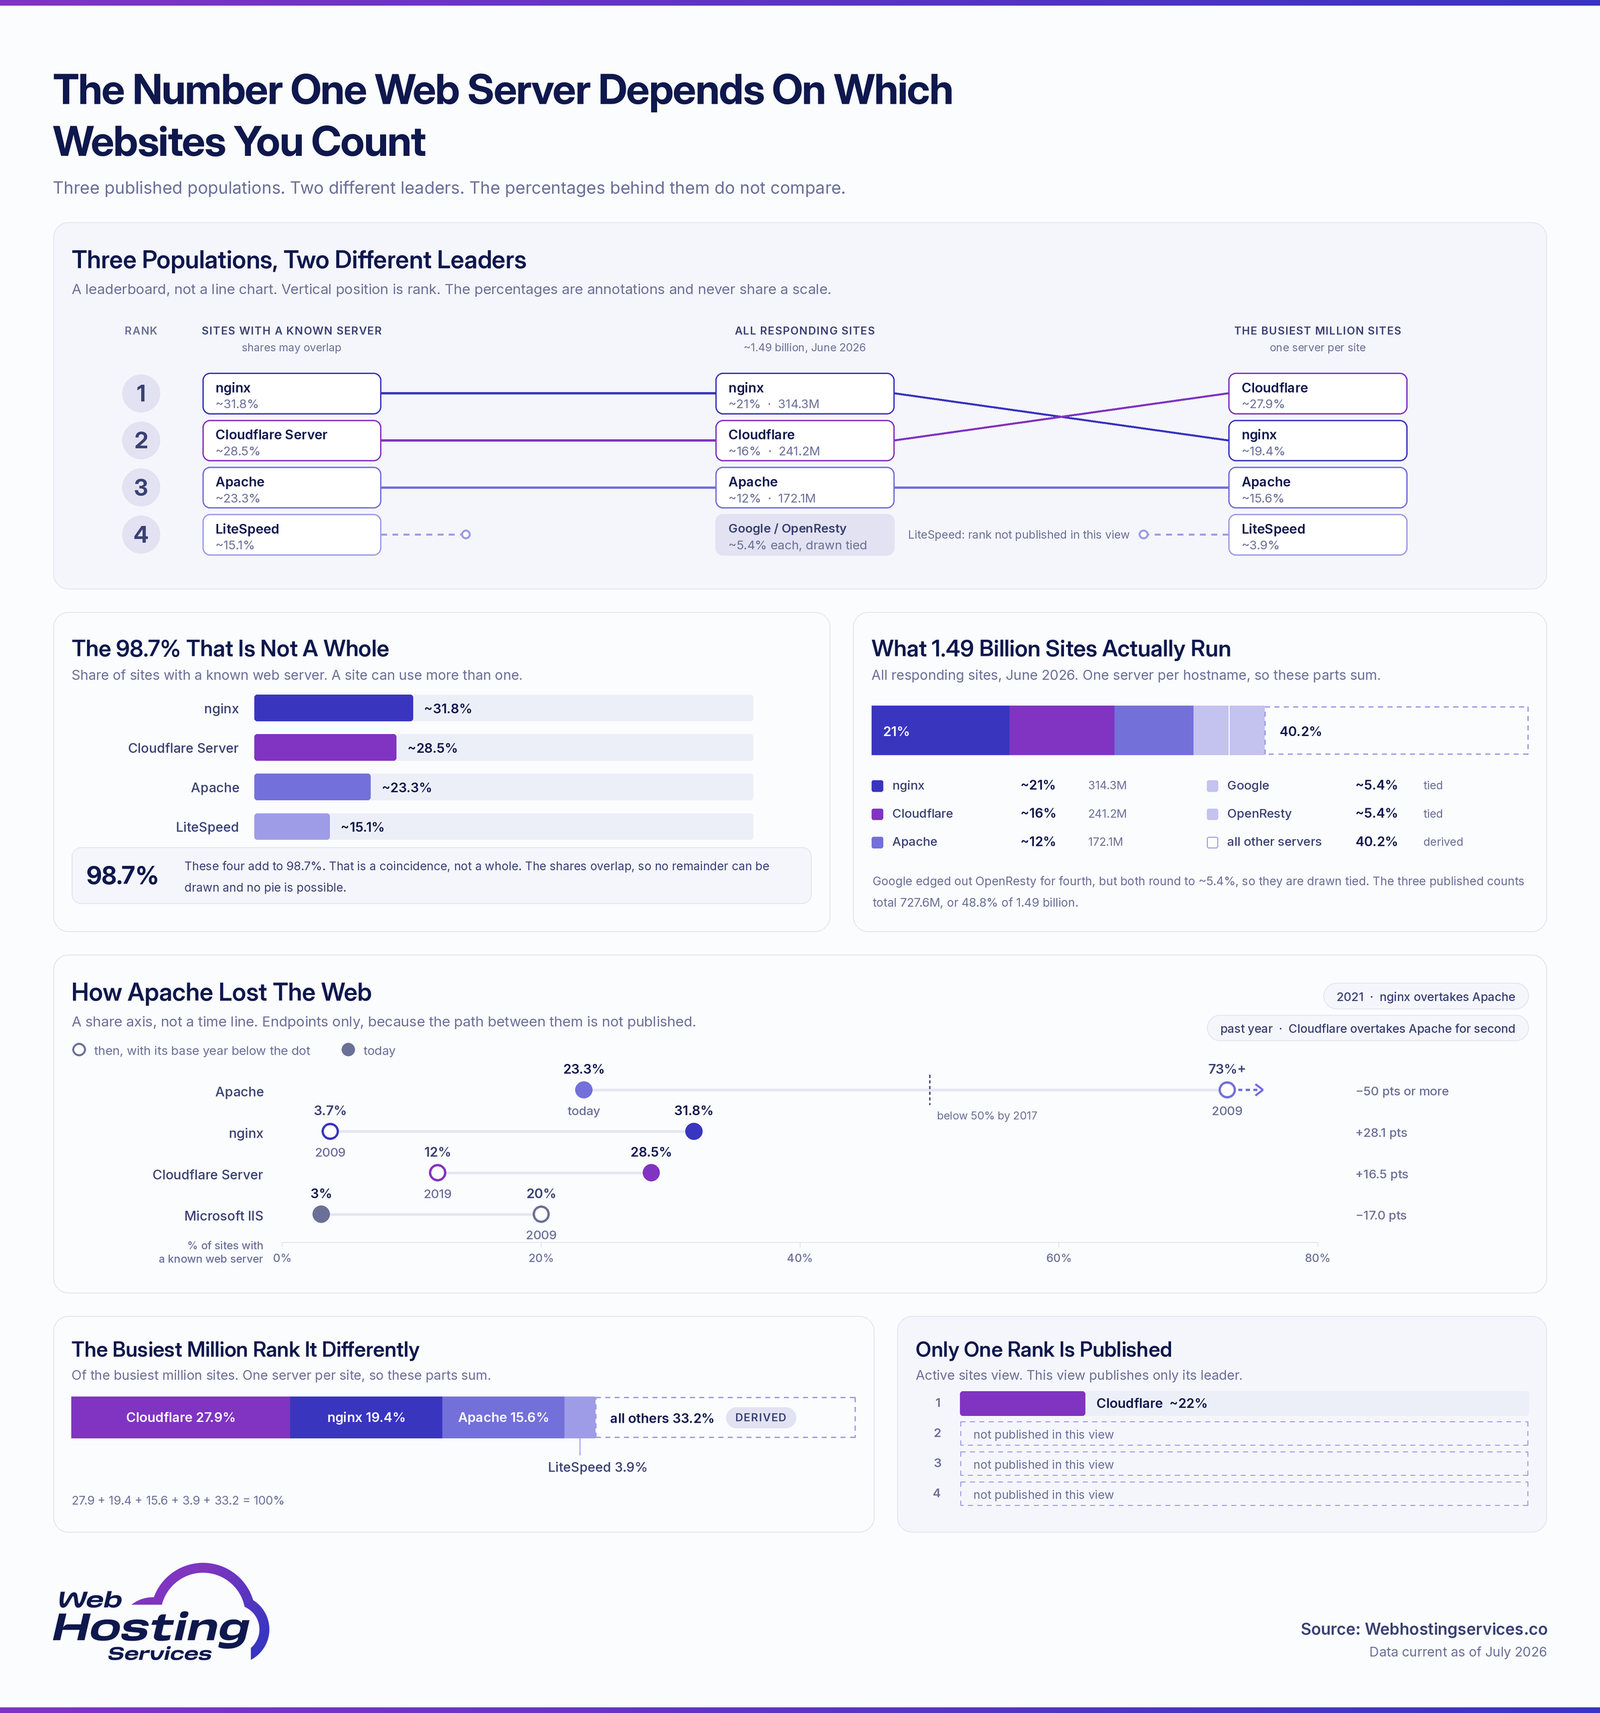
Research highlights: Nginx leads web servers at about 32% of sites with a known server, ahead of Cloudflare Server at about 28%, Apache at 23% and LiteSpeed at 15%, per W3Techs. Netcraft, which counts about 1.49 billion responding sites, ranks the shares lower, with nginx near 21% and Cloudflare 16%. The market has shifted decisively from the Apache-dominated web of a decade ago.
Related research: How many websites are there? | CDN market share | Website hacking statistics | DDoS attack statistics | WordPress market share
Which web server has the largest market share?
Note: W3Techs measures sites with a known web server, and a site can use more than one, so shares can overlap.
- Nginx leads at about 31.8% of sites with a known web server, per W3Techs.
- Cloudflare Server is second at about 28.5%.
- Apache is third at about 23.3%.
- LiteSpeed holds about 15.1%.
- Together these four dominate, though W3Techs counts sites that may run more than one server.
Web server | W3Techs share of known-server sites |
nginx | ~31.8% |
Cloudflare Server | ~28.5% |
Apache | ~23.3% |
LiteSpeed | ~15.1% |
Nginx and Cloudflare now define the W3Techs leaderboard. Their listed shares together exceed 60% of known-server sites, although W3Techs notes that server usage can overlap when a site uses more than one web server. That still marks a clear shift from the Apache-dominated web of a decade ago.
How do Nginx, Cloudflare and Apache compare?
- Nginx leads at about 32% in W3Techs, favored for performance and as a reverse proxy.
- Cloudflare Server is now second at about 28%, driven by its proxy network.
- Apache has fallen to third at about 23% in W3Techs’ known-server data, down sharply from its earlier dominance.
- Nginx overtook Apache as the top server in 2021, and Cloudflare overtook Apache for second in the past year.
- Netcraft’s broader count of all responding sites ranks them lower and closer together.
Web server | W3Techs, known-server sites |
nginx | ~31.8% |
Cloudflare | ~28.5% |
Apache | ~23.3% |
The rivalry has changed shape in W3Techs’ known-server data. What was long a two-way race between Nginx and Apache is now led by Nginx and Cloudflare Server, while proxy and edge platforms reshape how sites are served and counted. Because W3Techs allows overlap when a site uses more than one web server, these shares should not be read as exclusive buckets.
How many sites does each web server power in Netcraft’s survey?
Note: Netcraft counts every responding hostname, so its all-sites shares differ from W3Techs and from its own active-sites view.
- Netcraft counted about 1.49 billion responding sites in June 2026.
- Nginx led at about 21% of all sites, or 314.3 million.
- Cloudflare followed at about 16%, or 241.2 million.
- Apache held about 12%, or 172.1 million.
- Google edged out OpenResty for fourth, at about 5.4% each.
Web server | Netcraft all-site share |
nginx | ~21% |
Cloudflare | ~16% |
Apache | ~12% |
~5.4% | |
OpenResty | ~5.4% |
Netcraft’s broader count reshuffles the picture. Because it includes every responding hostname, including parked domains, the shares look lower than in W3Techs. In Netcraft’s active-sites view, Cloudflare actually leads at about 22%, showing how measurement choices change the ranking.
What is the history of web server market share?
- Apache dominated the early web, holding 73%+ in 2009.
- It fell below 50% by 2017 and sits near 23% today.
- Nginx grew from 3.7% in 2009 to the top spot, overtaking Apache in 2021.
- Cloudflare Server rose from about 12% in W3Techs’ visible 2019 yearly trend data to about 28% today.
- Microsoft IIS fell from about 20% in 2009 to about 3%.
Web server | Then to now |
Apache | 73%+ (2009) to ~23% |
nginx | 3.7% (2009) to ~32% |
Cloudflare | ~12% (2019 yearly trend data) to ~28% |
The long arc is one of reinvention. Apache dominated W3Techs’ early survey history, Nginx overtook Apache in 2021 and Cloudflare’s proxy model has grown quickly in recent years, leaving the market more concentrated and more infrastructure-driven than it was a decade ago.
Which web servers do the busiest websites use?
- Among Netcraft’s top million busiest sites, Cloudflare leads at about 28%.
- Nginx is second at about 19%.
- Apache follows at about 16%.
- LiteSpeed holds about 4%.
- High-traffic sites lean on Cloudflare’s edge and Nginx for performance.
Web server | Top million busiest sites |
Cloudflare | ~27.9% |
nginx | ~19.4% |
Apache | ~15.6% |
LiteSpeed | ~3.9% |
The busiest sites tell a different story. Cloudflare’s edge network fronts the largest share of top sites, with Nginx close behind, reflecting how high-traffic operators lean on proxies and performance-focused servers rather than traditional hosting stacks. For related infrastructure data, see our CDN market share research.
Sources & additional resources
- W3Techs. “Usage Statistics and Market Share of Web Servers.” W3Techs.
- W3Techs. “Historical Yearly Trends in the Usage of Web Servers.” W3Techs.
- W3Techs. “Nginx Is Now the Most Popular Web Server, Overtaking Apache.” W3Techs.
- W3Techs. “Nginx Reaches 33.3% Web Server Market Share While Apache Falls Below 50%.” W3Techs.
- Netcraft. “June 2026 Web Server Survey.” Netcraft.
Web Hosting Services helps you pick the right stack, with independent hosting research, current hosting deals and managed WordPress hosting with caching and tuned servers built to keep pages quick.
Disclaimer: This article is for informational purposes only and is not legal, technical, cybersecurity, business, hosting, infrastructure, SEO, financial or purchasing advice. Web server market share statistics, W3Techs known-server data, Netcraft all-site and active-site counts, top-million site rankings, historical usage trends, proxy-server classifications, overlapping server detections, responding-hostname counts and third-party methodologies can change at any time and may vary by source, reporting period, website sample, crawler coverage, server-header detection, reverse-proxy use, hosting setup, parked-domain treatment and measurement definition. Always confirm current figures, server requirements, hosting needs, performance assumptions, security considerations and methodology directly with the cited data provider, hosting provider, server vendor, technical documentation or qualified professional before making web server, hosting, infrastructure, security or purchasing decisions based on web server market share statistics.