




Get practical hosting tips in your inbox

By pressing the Subscribe button, you confirm that you have read and are agreeing to our Privacy Policy and Terms of Use
Follow Us
Follow Us

Bot traffic statistics - how much of the web is bots?

Mendy Perlman, Researcher at Web Hosting Services By: Mendy Perlman | Updated: July 15, 2026 | Fact Checked |
Cite this Research

Cite this research

APA

Perlman, M. (2026, July 15). Bot traffic statistics - how much of the web is bots? Web Hosting Services. https://webhostingservices.co/research/bot-traffic-statistics

MLA

Perlman, Mendy. “Bot Traffic Statistics - How Much of the Web Is Bots?” Web Hosting Services, 15 July 2026, https://webhostingservices.co/research/bot-traffic-statistics.

Chicago

Perlman, Mendy. “Bot Traffic Statistics - How Much of the Web Is Bots?” Web Hosting Services. Last modified July 15, 2026. https://webhostingservices.co/research/bot-traffic-statistics.
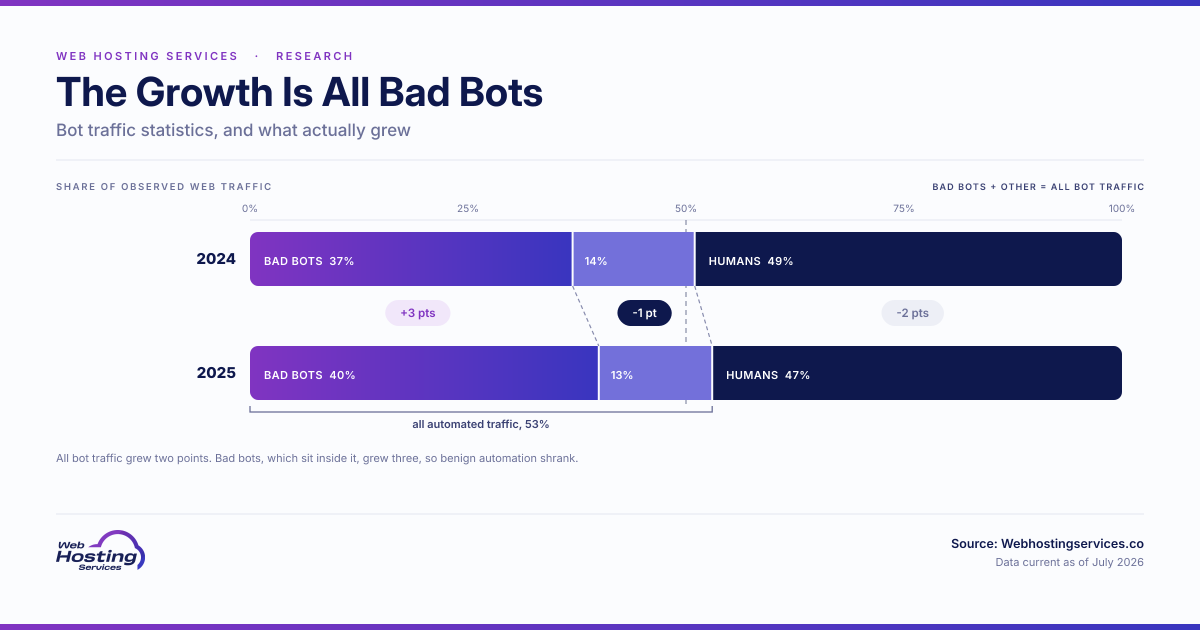
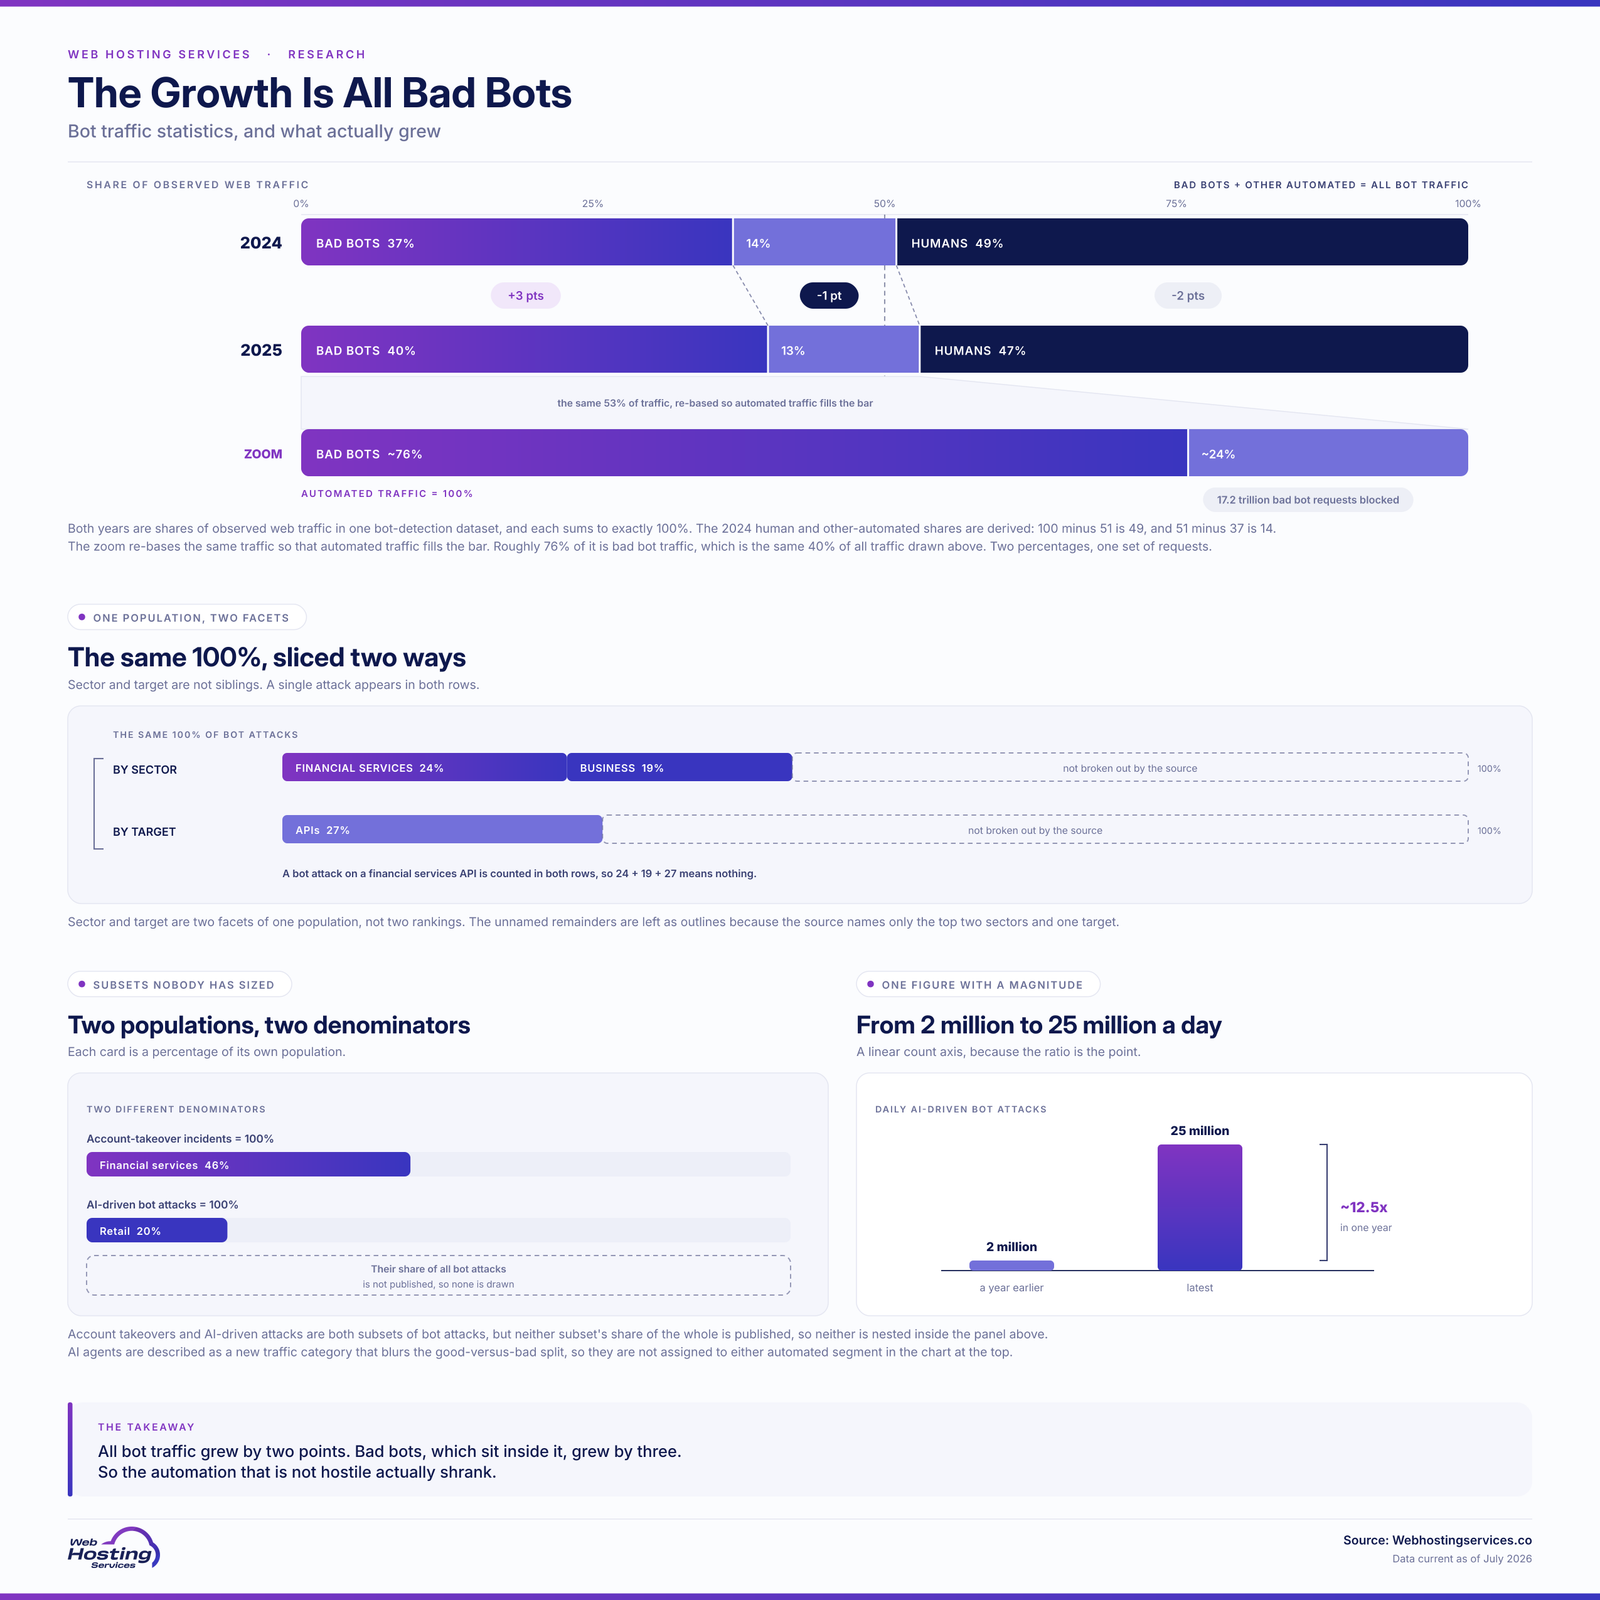
Research highlights: Bots made up 53% of web traffic in 2025 in the Thales/Imperva Bad Bot Report, up from 51% a year earlier and their second straight year as the majority. Malicious “bad bots” accounted for 40% of traffic, up 3 percentage points from the year before, leaving humans at 47%. Thales ties the surge to AI-driven automation and AI agents, which have made automated activity easier to create, scale and disguise.

Featured image comparing 2024 and 2025 web traffic composition, with bad bots rising 3 points to 40%, other automation falling 1 point to 13%, and humans falling 2 points to 47%.
Bots are 53% of web traffic, but bad bots grew faster than automation as a whole, so benign automation shrank.

What percentage of internet traffic comes from bots?

  • Bots made up 53% of web traffic in 2025 in the Thales/Imperva Bad Bot Report.
  • Human traffic fell to 47% of the total in that dataset.
  • This is the second straight year bots have been the majority, after automated traffic first crossed 50% in 2024.
  • Thales says it blocked 17.2 trillion bad bot requests in 2025.
  • In Thales/Imperva’s reporting, humans are now the minority of web traffic.

Traffic type

Share

Bots (automated)

53%

Humans

47%

This is a genuine tipping point for the web. When most observed traffic is automated, the assumptions behind analytics, security and infrastructure all shift, since many visits may come from software agents, scripts or malicious bots rather than people.


What share of bot traffic is bad bots versus other automation?

  • Bad bots account for 40% of internet traffic in the Thales/Imperva report.
  • Total automated traffic is 53%, leaving about 13% as non-bad automated traffic.
  • That means roughly 76% of automated traffic is bad bot traffic.
  • Bad bots handle scraping, account takeover, fraud, scalping and business logic abuse.
  • Legitimate automation includes search crawlers, monitoring tools and some AI agents, but Thales says AI agents are now a distinct category that blurs the old good-versus-bad split.

Bot type

Share of all traffic

Bad bots

40%

Other automated traffic

~13%

The worrying part is the balance within automated traffic. In the headline split, roughly three-quarters of automated traffic is bad bot traffic, so the rise in bots is not simply helpful crawlers. It also reflects a growing tide of hostile or unmanaged automation aimed at businesses.


Has automated traffic overtaken human web traffic?

  • Yes, automated traffic reached 53% versus 47% human.
  • The crossover, first hit in 2024, held and widened in 2025.
  • The shift was accelerated by AI, large language models and a new wave of AI agents, according to Thales.
  • These tools have lowered the barrier to creating and scaling automated activity, including for less sophisticated actors.
  • Human traffic continues to decline, per Thales.

Traffic type

Share

Automated (bots)

53%

Human

47%

The trajectory is the real story. Crossing 50% was symbolic, but a second straight year in the majority, with human traffic still falling, shows how fast automation is reshaping who, and what, actually uses the web.


Which industries receive the most bot attacks?

Note: industry figures come from Thales/Imperva bot-attack data and vary by sector and measurement window.

  • Financial services was the most-attacked sector, drawing 24% of all bot attacks in the Thales/Imperva data.
  • Business ranked second, accounting for 19% of bot attacks.
  • Financial services was also the top account-takeover target, at 46% of ATO incidents.
  • 27% of bot attacks targeted APIs, making APIs a major automated attack surface.
  • Retail was the top sector for AI-driven bot attacks, at 20% of AI bot attacks.

Metric

Bot exposure

Financial services

24% of bot attacks

Business

19% of bot attacks

Financial services (ATO)

46% of account-takeover incidents

APIs

27% of bot attacks

Retail

20% of AI bot attacks

The pattern follows value and APIs. In the Thales/Imperva data, financial services attracted the largest share of bot attacks and account-takeover incidents, while API-targeted attacks show how automation can bypass user interfaces and hit backend business logic directly. See our website hacking research.


  • Bad bot traffic rose to 40%, up from 37% the year before.
  • Thales says that is a 3 percentage point year-over-year increase.
  • Overall bot traffic reached 53%, up from 51%, a second year in the majority.
  • Human traffic keeps falling as automation takes a larger share.
  • The 2026 edition is the 13th annual Bad Bot Report.

Year

Bad bot share

2024

37%

2025

40%

The long-term direction is upward. Across more than a decade of tracking, bad bot traffic has climbed in recent years, and the latest jump shows how AI-driven automation is adding pressure to an already-growing problem.


How is AI driving the growth of bot traffic?

  • AI and LLMs have lowered the barrier to creating and scaling automated attacks.
  • AI agents have emerged as a new category of internet traffic alongside good and bad bots.
  • Thales tracked a jump in daily AI-driven bot attacks from 2 million to 25 million in a year, about 12.5 times.
  • API-directed attacks made up 27% of bot attacks.
  • Retail accounted for 20% of AI bot attacks in the Thales/Imperva data.

Metric

Figure

Daily AI-driven bot attacks

2 million to 25 million

Bot attacks targeting APIs

27%

Retail share of AI bot attacks

20%

AI has changed the math of attacks. By making automated tooling easier to create, scale and disguise, it has increased machine-driven activity while making some attacks harder to detect, a double squeeze on defenders. See our DDoS attack research.


Sources & additional resources

Web Hosting Services helps you keep bots from dragging down your site, with independent security and hosting research, current hosting deals and managed WordPress hosting with managed updates, backups, a built-in CDN, firewalls, brute-force protection and malware scanning.

Disclaimer: This article is for informational purposes only and is not legal, technical, cybersecurity, financial, insurance, business, hosting, bot-mitigation or purchasing advice. Bot traffic statistics, bad-bot shares, human-versus-automated traffic estimates, AI-driven bot activity, account-takeover data, API attack figures, industry targeting data, blocked-request totals, threat-report findings and third-party methodologies can change at any time and may vary by source, reporting period, provider network, website sample, industry, geography, traffic classification, detection method and measurement definition. Always confirm current figures, bot risks, security requirements, mitigation needs, hosting needs, compliance obligations, incident-response plans and methodology directly with the cited source, security provider, hosting provider, legal advisor, insurer, cybersecurity professional or qualified expert before making bot-management, hosting, security, business, insurance or purchasing decisions based on bot traffic statistics.

Infographic on bot traffic statistics showing bots at 53% of web traffic and humans at 47%, with bad bots up 3 points to 40% while all bot traffic rose only 2 points, meaning benign automation shrank.
All bot traffic grew by two points. Bad bots, which sit inside it, grew by three. So the automation that is not hostile actually shrank.