











Website Security and Trust Statistics
Research updated for 2026
Security data has a credibility problem, because much of it is published by vendors selling the solution. These four pages lean on the sources with the broadest measurement and the clearest methodology.
They cover how encrypted the web has become, what breaches actually cost and how they start, how attack volumes are changing, and how much of your traffic is not human.
HTTPS and SSL adoption statistics
HTTPS adoption climbed quickly and then plateaued, and the certificate authority market concentrated sharply as it did. This covers encryption rates by measure and who issues most of the web’s certificates.
Website security statistics - how many sites get hacked?
Most breaches are not sophisticated, which is either reassuring or alarming depending on your view. This covers breach costs, how often people are the entry point, and the scale of sites flagged as unsafe.
DDoS attack statistics
Attack volume and attack size are both growing, but not at the same rate or for the same reasons. This covers mitigation counts, record peaks, and the botnets driving the change.
Bot traffic statistics - how much of the web is bots?
Bots have been the majority of web traffic for two consecutive years, and the malicious share is growing faster than the benign one. This covers the split and what AI automation has changed about it.
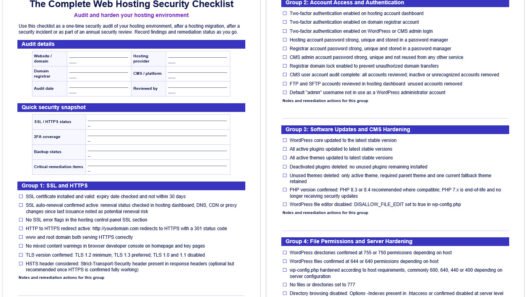
These pages describe the threat landscape. To act on it, the web hosting security checklist covers hardening a specific environment. For what an outage costs once something does go wrong, see the cost of website downtime, and for certificate pricing see SSL certificate cost research. Return to all research.