










 By: Mendy Perlman
|
Updated: June 21, 2026
|
Fact Checked
|
By: Mendy Perlman
|
Updated: June 21, 2026
|
Fact Checked
|
Cite this Research
Cite this research
Perlman, M. (2026, June 21). What is the cloud hosting market size and share? Web Hosting Services. https://webhostingservices.co/research/cloud-market-share-statistics
Perlman, Mendy. “What Is the Cloud Hosting Market Size and Share?” Web Hosting Services, 21 June 2026, https://webhostingservices.co/research/cloud-market-share-statistics.
Perlman, Mendy. “What Is the Cloud Hosting Market Size and Share?” Web Hosting Services. Last modified June 21, 2026. https://webhostingservices.co/research/cloud-market-share-statistics.
How big is the cloud infrastructure market?
Note: cloud market totals are analyst estimates, drawn here from Synergy Research.
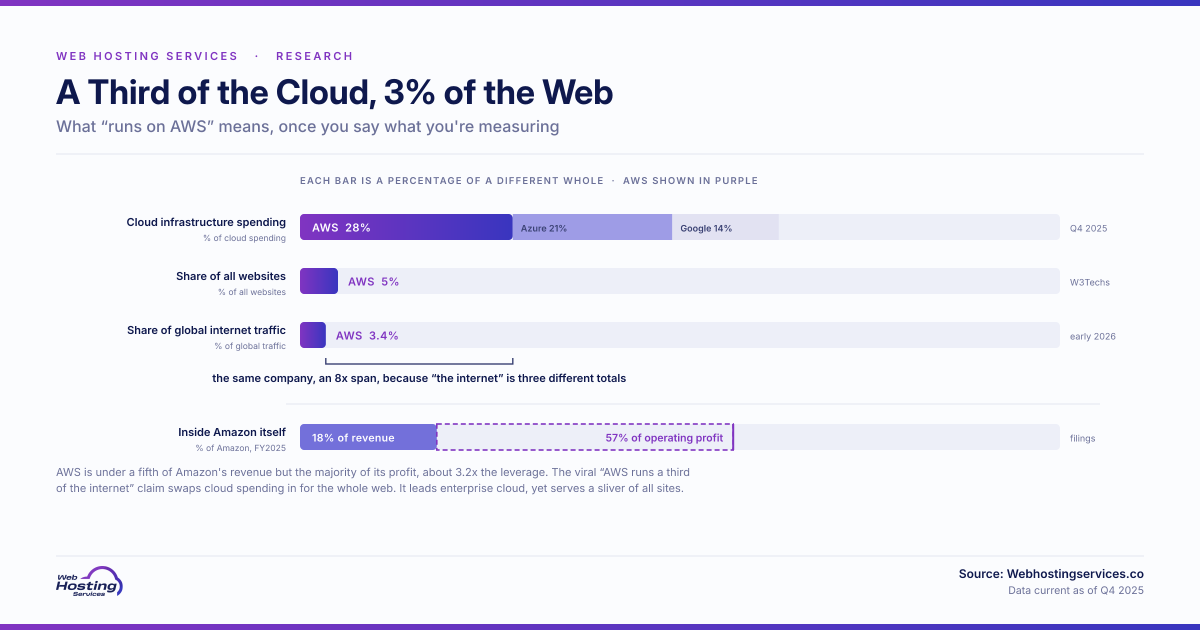
- Worldwide cloud infrastructure revenue reached $419 billion across all of 2025.
- The fourth quarter of 2025 alone generated $119.1 billion in revenue.
- Annualized, that fourth-quarter pace put the market on a run-rate of about $476 billion.
- Generative AI was the single biggest driver of the spending surge.
- By the first quarter of 2026, growth had accelerated to about 35%, putting the market at an annual revenue run-rate above $500 billion.
Metric | Figure |
Full-year 2025 revenue | $419 billion |
Q4 2025 revenue | $119.1 billion |
Annual run-rate (Q4 2025 annualized) | ~$476 billion |
Cloud infrastructure has become one of the largest environments for modern computing workloads. The AI boom turned an already fast-growing market into one of the defining spending stories in technology.
What is the AWS vs Azure vs Google Cloud market share?
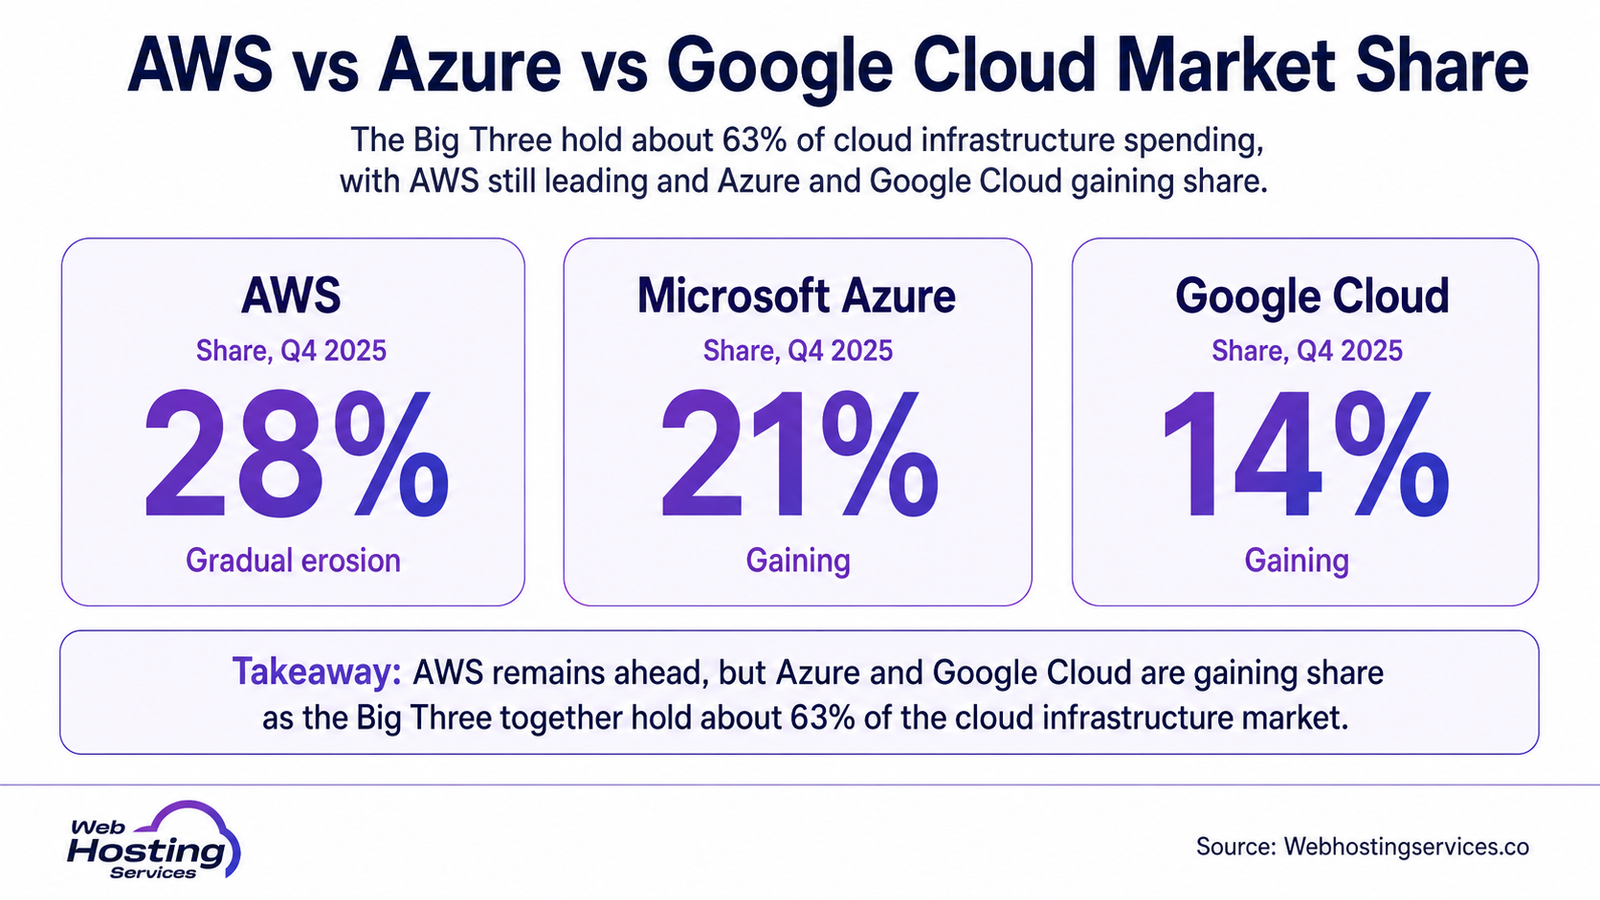
- The Big Three together held about 63% of cloud infrastructure spending through 2025.
- In the third quarter of 2025, AWS led with about 29%, ahead of Microsoft Azure at 20% and Google Cloud at 13%.
- By the fourth quarter the split had shifted to about 28%, 21% and 14% respectively, as Azure and Google gained.
- AWS’s share has gradually eroded from a little over 32% in 2021 as rivals gain ground.
- Azure and Google Cloud are growing faster, slowly closing the gap on the leader.
Provider | Share (Q4 2025) | Trend |
AWS | 28% | Gradual erosion |
Microsoft Azure | 21% | Gaining |
Google Cloud | 14% | Gaining |
The race is tightening, but AWS remains firmly in front. Its lead is eroding slowly rather than collapsing, and third-place Google still towers over the chasing pack, running nearly four times the size of the next-largest provider.
What percent of the internet runs on AWS?
Note: there is no single clean figure here, since the answer changes with what you measure.
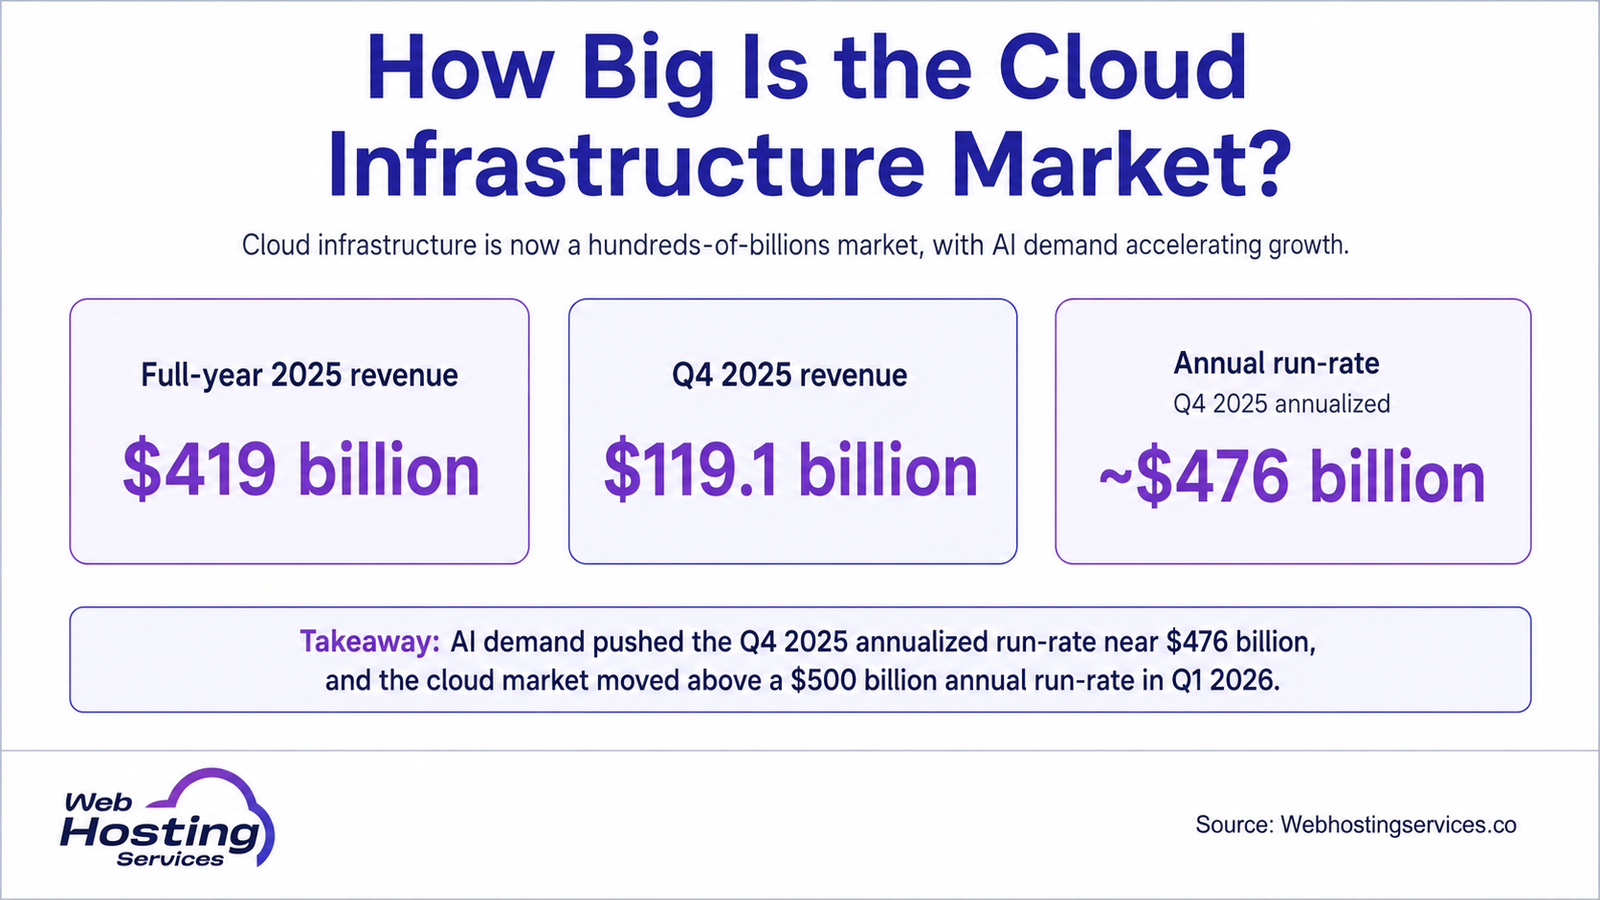
- By cloud infrastructure spending, AWS holds roughly 28% to 29% of the market.
- By share of all websites, W3Techs puts AWS closer to 5%.
- By internet traffic, AWS carried about 3.4% of global traffic in early 2026, while six cloud and cloud-adjacent networks carried over 11% combined.
- AWS concentrates heavily, with its us-east-1 region handling about 41.5% of AWS requests.
- The honest answer is that AWS powers a large share of major apps but a small share of all websites.
Measure | AWS share |
Cloud infrastructure spending | ~28% to 29% |
Share of all websites | ~5% |
AWS share of global internet traffic | ~3.4% |
Six cloud and cloud-adjacent networks combined | 11%+ |
The viral claim that AWS runs a third of the internet conflates cloud spending with the whole web. AWS dominates enterprise cloud, hosts many of the largest apps, yet still serves only a sliver of the world’s total websites by count.
What share of Amazon’s revenue and profit is AWS?
- AWS generated $35.6 billion in revenue in the fourth quarter of 2025, up 24% year over year, its fastest growth in over three years.
- That was about 17% of Amazon’s total net sales of $213.4 billion that quarter.
- For full-year 2025, AWS brought in $128.7 billion in revenue and $45.6 billion in operating income.
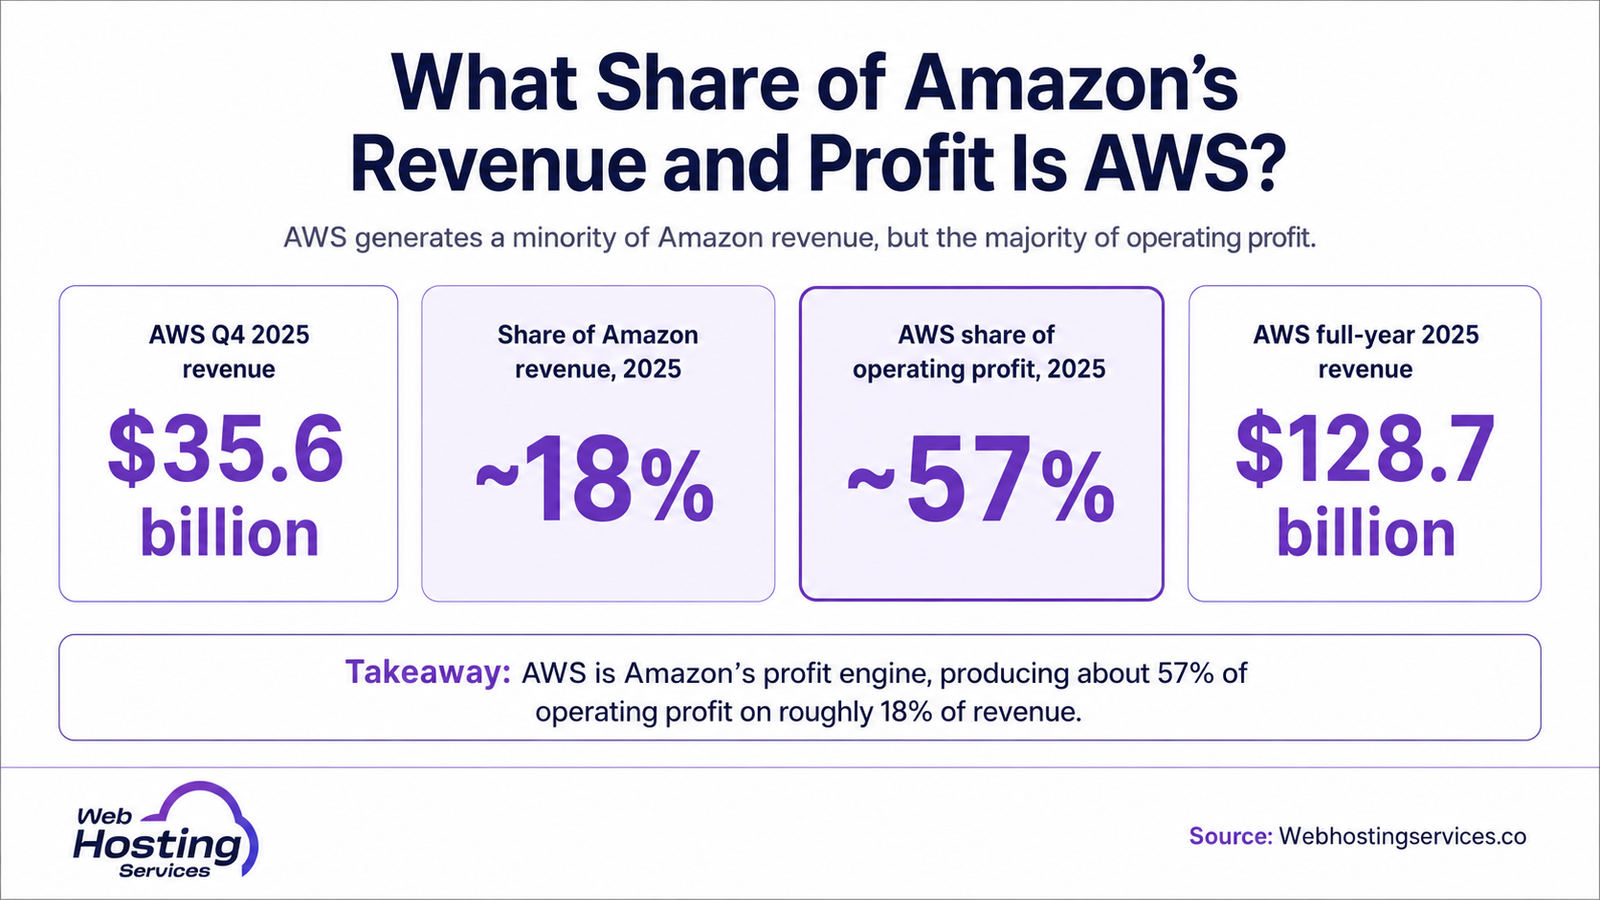
- That operating income was about 57% of Amazon’s $80.0 billion full-year operating profit, on roughly 18% of revenue.
- AWS is the profit engine that funds the rest of Amazon’s lower-margin businesses.
Metric | Figure |
AWS Q4 2025 revenue | $35.6 billion |
Share of Amazon revenue (2025) | ~18% |
AWS share of operating profit (2025) | ~57% |
AWS full-year 2025 revenue | $128.7 billion |
The numbers reveal Amazon’s real business model. A division that is less than a fifth of revenue produces the majority of profit, letting Amazon reinvest those cloud margins into retail, logistics and AI at a scale rivals struggle to match.
How fast is the cloud market growing?
Note: growth figures come from Synergy Research and reflect cloud infrastructure services.
- Cloud infrastructure revenue grew about 30% year over year in the fourth quarter of 2025.
- Public IaaS and PaaS services, the bulk of the market, grew 34% in the same quarter.
- The fourth quarter marked the ninth consecutive quarter of accelerating year-over-year growth.
- Generative AI demand is the primary force behind the acceleration.
- Growth accelerated further to about 35% in the first quarter of 2026, the fastest pace in years.
Metric | Figure |
Q4 2025 YoY growth | ~30% |
Public IaaS/PaaS growth | ~34% |
Consecutive accelerating quarters | 9 |
Growth at this scale is unusual for so large a market. After a 2023 slowdown when companies optimized spending, the AI wave reignited demand, pushing the cloud back to growth rates not seen since 2022.
How many customers and regions does AWS have?
- AWS operates 39 regions worldwide, each a distinct geographic cluster of data centers.
- Those regions contain 123 availability zones, with more announced for future launch.
- AWS serves millions of active customers, from startups to global enterprises and governments.
- It launched in 2006 and helped popularize pay-as-you-go cloud infrastructure.
- Its us-east-1 region in Northern Virginia remains the busiest, handling a huge share of requests.
Metric | Figure |
Regions worldwide | 39 |
Availability zones | 123 |
Active customers | Millions |
Launched | 2006 |
That global footprint is the moat. Replicating dozens of regions and over a hundred availability zones takes years and enormous capital, which is a core reason the Big Three keep pulling ahead. For pricing, see our cloud hosting cost research.
Sources & additional resources
- “GenAI Helps Drive Quarterly Cloud Revenues to $119 Billion in Q4.” Synergy Research Group.
- “Cloud Market Annual Revenue Run Rate Topped Half a Trillion Dollars in Q1.” Synergy Research Group.
- “Cloud Market Share Trends: Big Three Together Hold 63%.” Synergy Research Group.
- “Amazon Quarterly Financial Results and Filings.” Amazon Investor Relations.
- “AWS Global Infrastructure.” Amazon Web Services.
- “Our Origins.” Amazon Web Services.
- “What Is AWS?.” Amazon Web Services.
- “AWS Q4 2025 Earnings Report.” CNBC.
- “Usage Statistics of Web Hosting Providers.” W3Techs.
- “Cloud Provider Traffic Share.” TechnologyChecker.
Web Hosting Services helps you navigate the cloud era, with independent hosting and cloud research, current hosting and cloud deals from providers across every tier, plus managed WordPress hosting built on fast, reliable cloud infrastructure.